The Big Story
Quick Take:
-
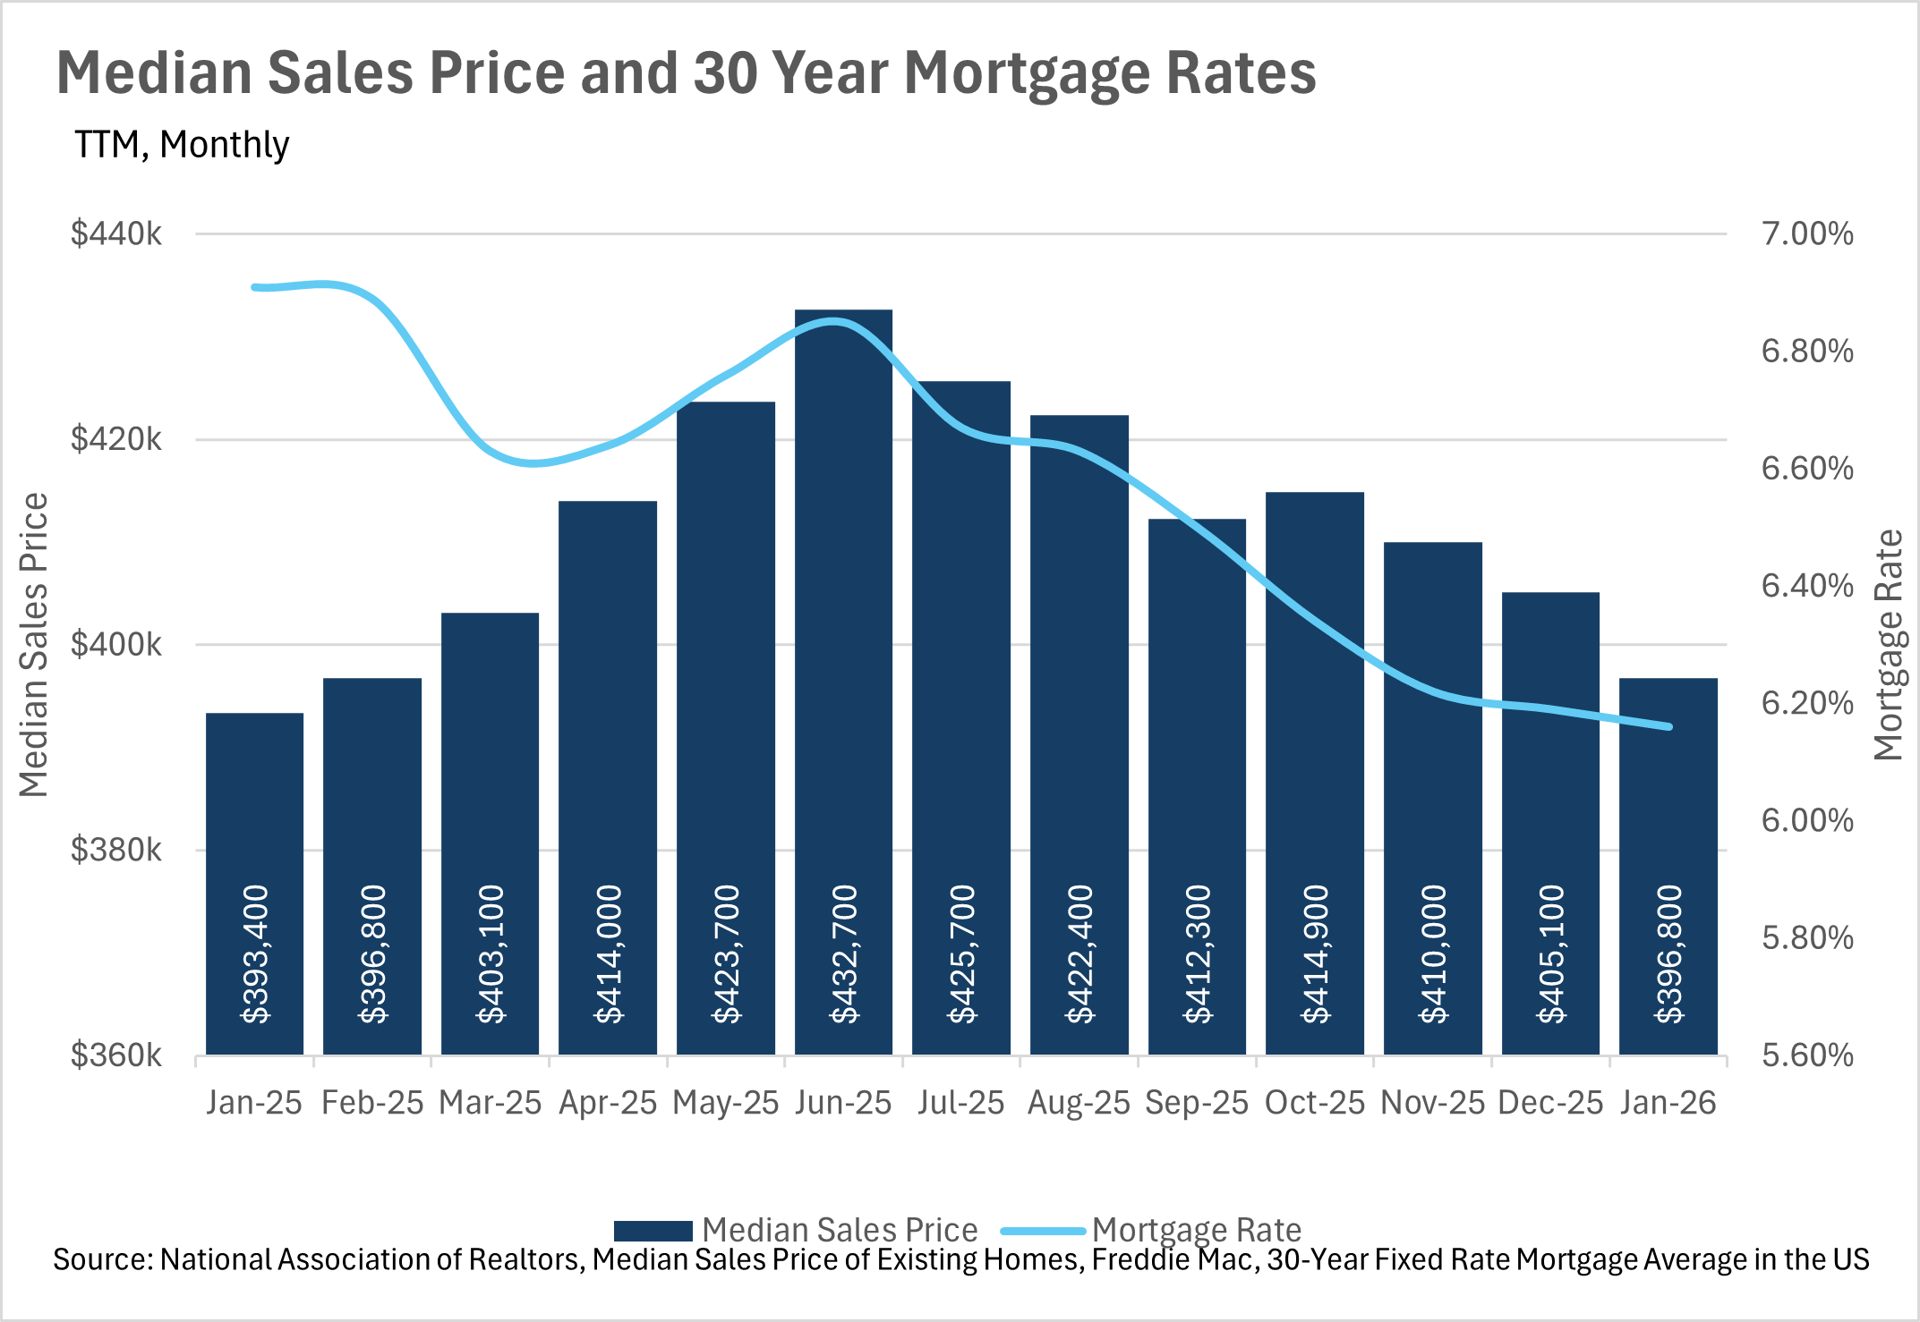
Median home sale prices are virtually flat on a year-over-year basis, as the market has settled into a holding pattern despite lower mortgage rates.
-
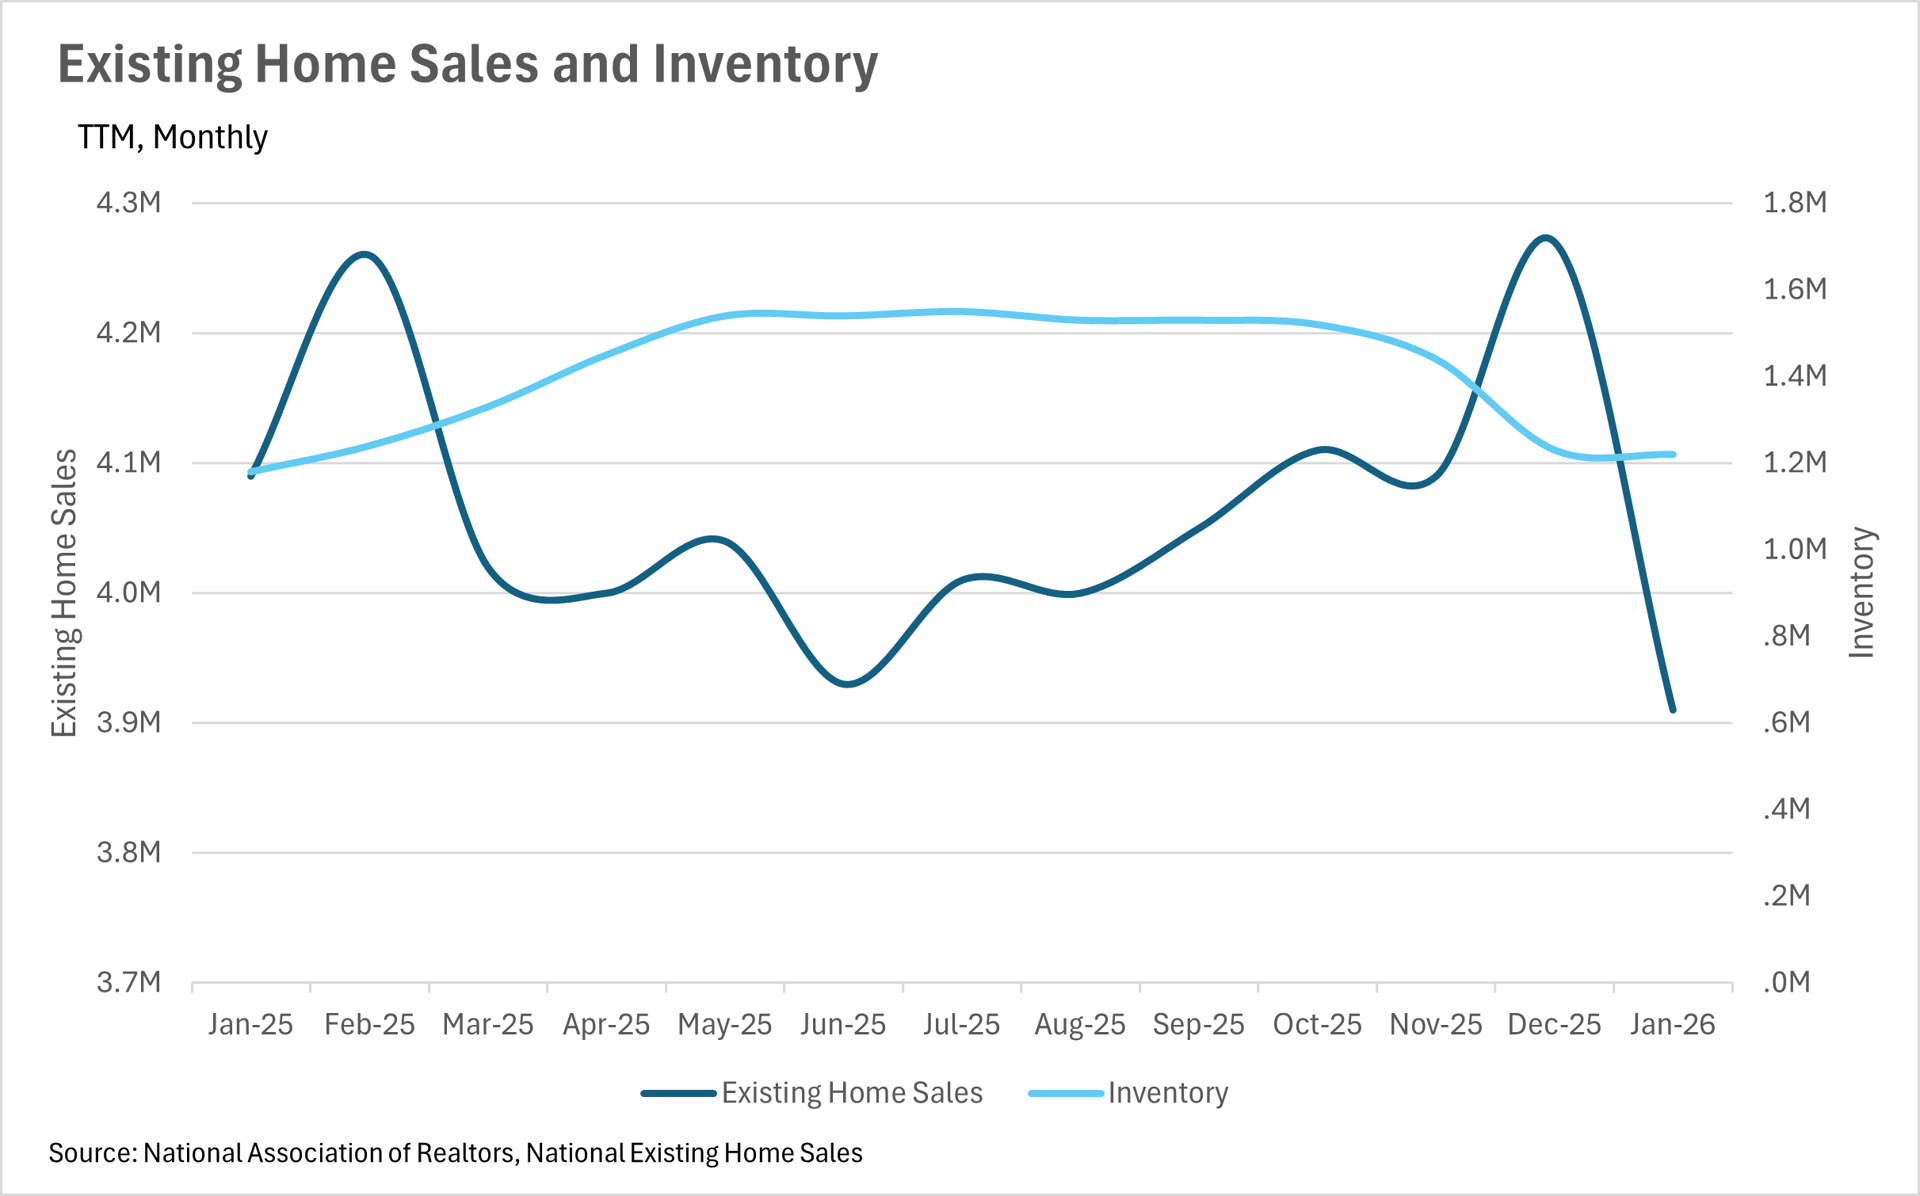
Inventory levels remain slightly elevated compared to last year, but the gap continues to narrow.
-
Existing home sales have pulled back on both a month-over-month and year-over-year basis, signaling that buyers are still waiting on the sidelines.
Note: You can find the charts & graphs for the Big Story at the end of the following section.
*National Association of REALTORS® data is released two months behind, so we estimate the most recent month’s data when possible and appropriate.
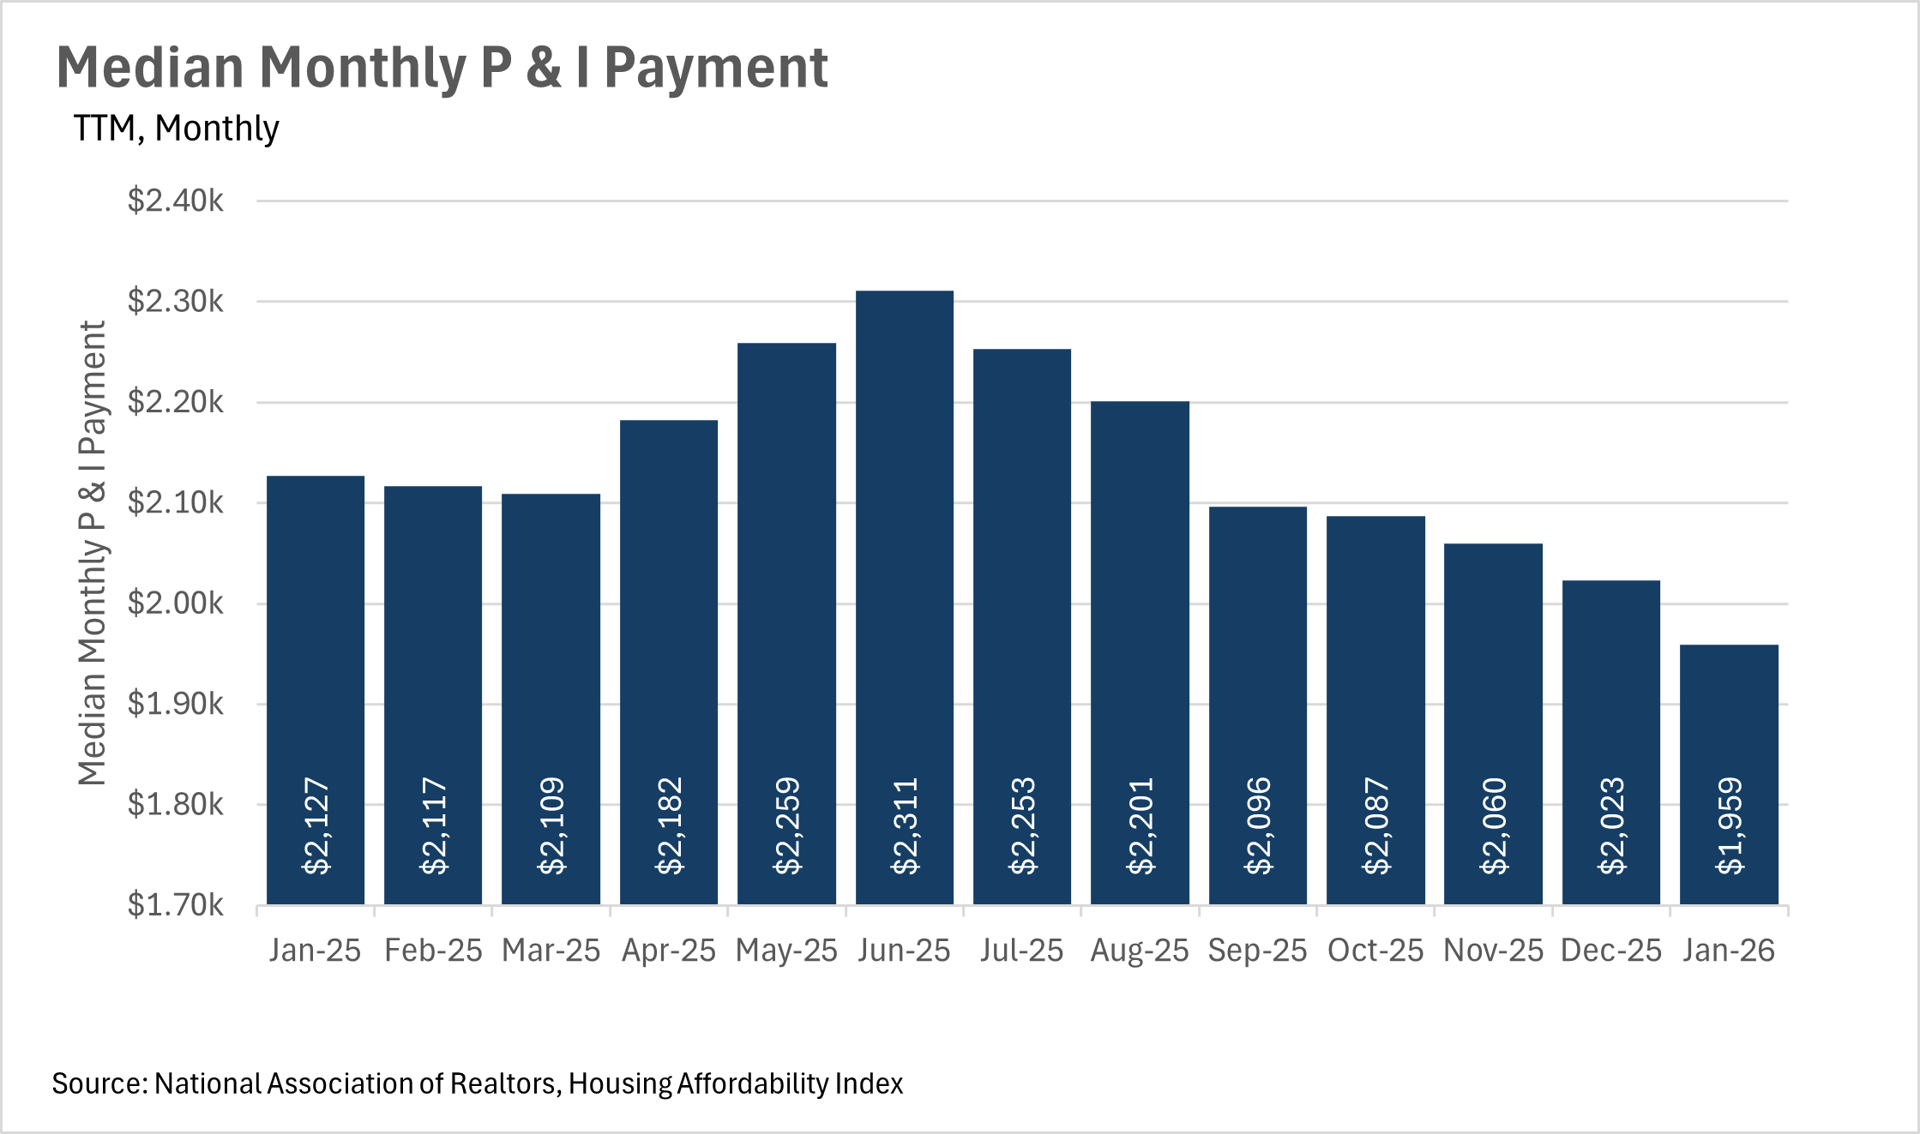
Lower rates are finally making homeownership more affordable!
One of the biggest stories in the housing market right now is the continued decline in mortgage rates, and what that means for the average homebuyer's wallet. The average 30-year mortgage rate sat at 6.16% in January, representing a 10.85% year-over-year decline from the 6.91% we were seeing just a year ago. This decline in rates has had a direct impact on monthly payments, with the median monthly P&I payment coming in at $1,959 in January, down 7.90% from the $2,127 that the median homeowner was paying this time last year. That's roughly $168 per month in savings, which is great news for the average American.
However, despite the fact that rates have come down substantially, the median home sale price has remained remarkably stable, coming in at $396,800 in January. This represents just a 0.86% increase on a year-over-year basis, and a 2.05% decline from December. It seems like the market has found a bit of equilibrium, as lower rates are being offset by cautious buyers who aren't quite ready to jump back in just yet.
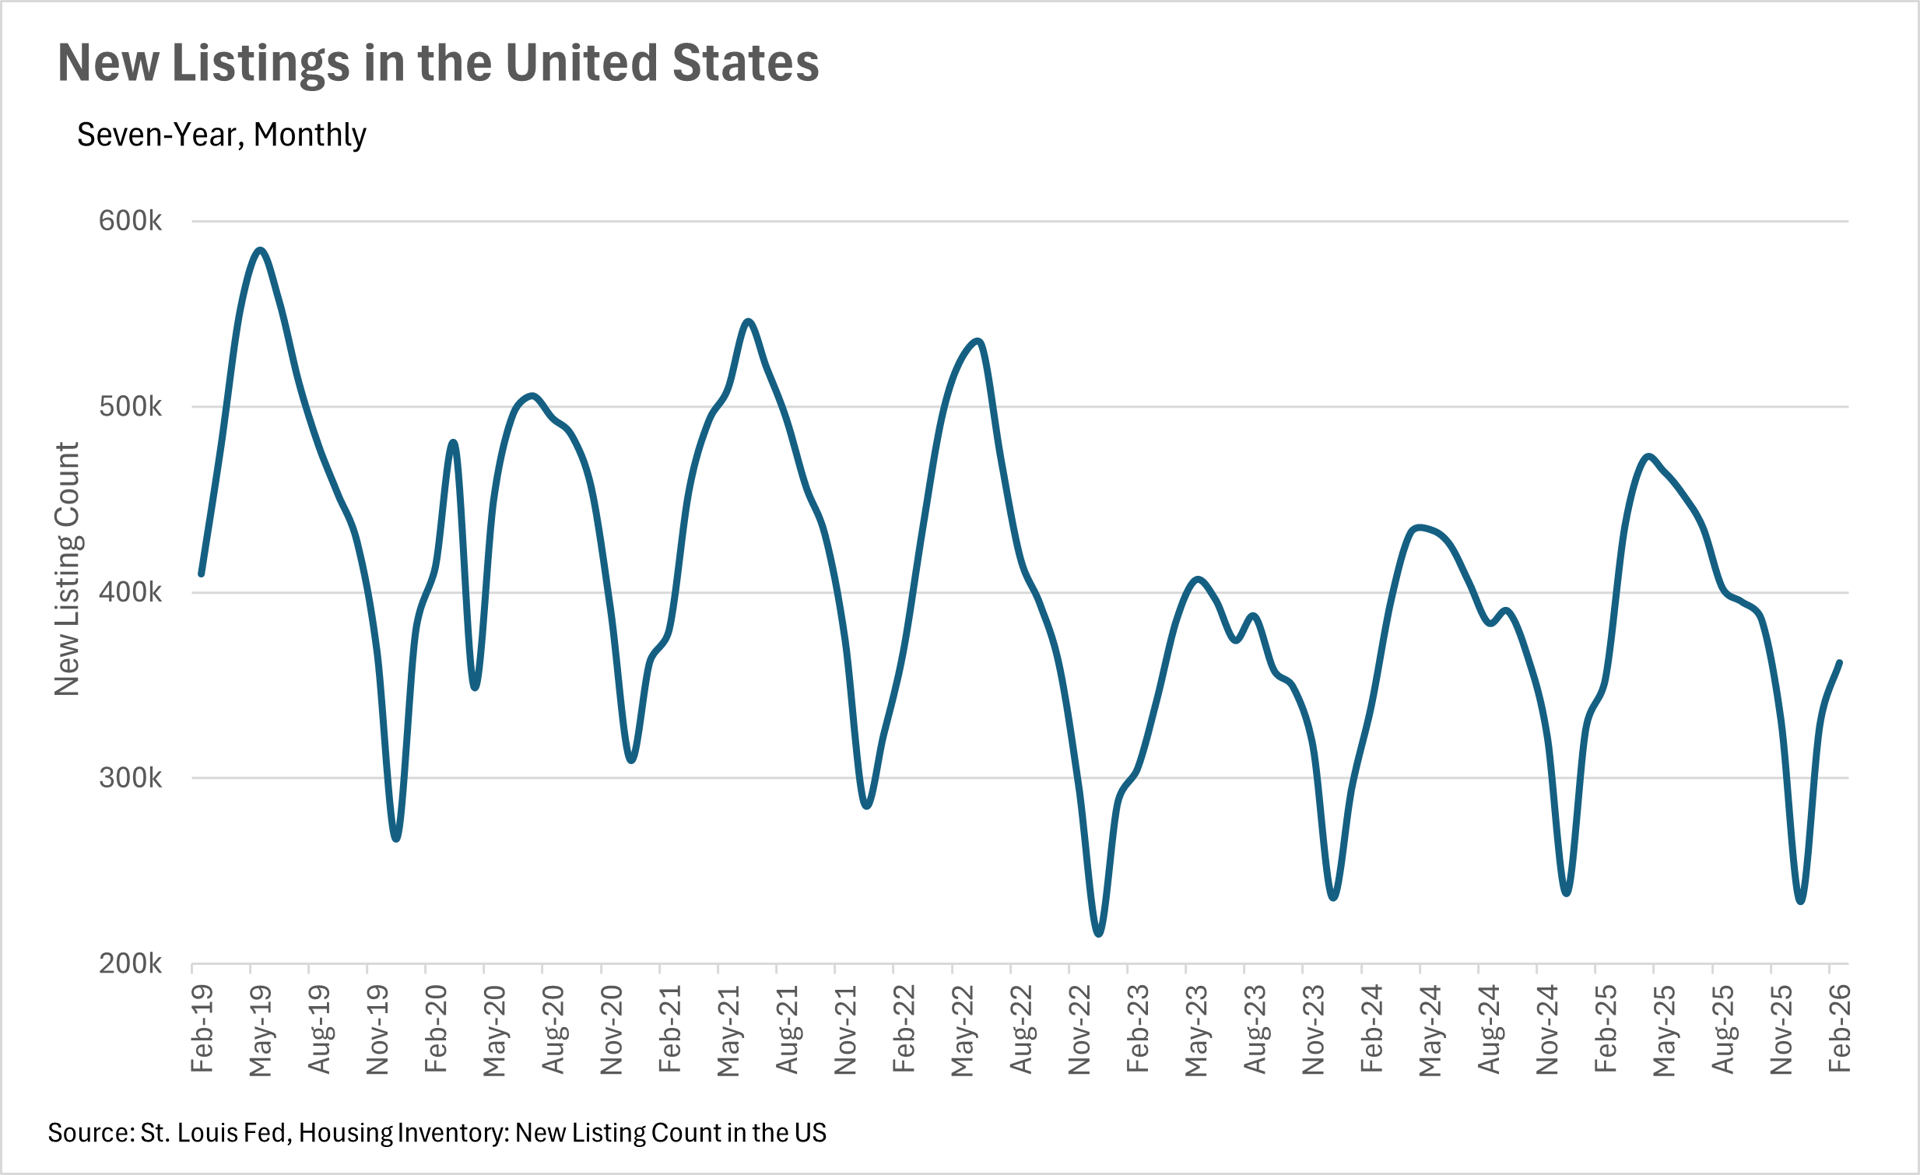
New listings are ticking up as we head into spring
As we move out of the seasonally slow winter months, we're starting to see new listings pick up, which is a great sign for the market heading into the spring. In February, there were 362,180 new listings that hit the market, representing a 2.41% year-over-year increase and a 10.01% month-over-month increase. This uptick in new listings is encouraging, as it suggests that homeowners are starting to feel more comfortable putting their homes on the market. On the inventory side, there were 1,220,000 homes available for sale in January, which is up 3.39% on a year-over-year basis. While this is certainly a step in the right direction, it's worth noting that inventory levels are still well below the levels we need to see in order for the market to truly become balanced. That said, the combination of rising new listings and modestly higher inventory levels should give buyers a few more options to choose from as we head into the busier spring months.
Buyers are still taking their time on the sidelines
Despite the fact that mortgage rates have come down by nearly 11% on a year-over-year basis, buyers are still being cautious. In January, existing home sales came in at 3,910,000, representing a 4.40% decline on a year-over-year basis and an 8.43% decline from December. This tells us that while the affordability picture has improved quite a bit, many buyers are still waiting for rates to come down even further before they make their move. It's also worth considering that the seasonal slowdown plays a role here, as January is historically one of the slower months for home sales. As we move into the spring and summer, it'll be worth keeping a close eye on this metric to see if the lower rates and increasing inventory levels are enough to bring buyers off the sidelines.
A market that could go either way in the coming months
Right now, the national market is in an interesting position. Inventory levels are slightly higher than they were last year, but existing home sales have declined, which means that the supply of homes on the market is lasting a bit longer than it was at this time last year. With new listings beginning to pick up heading into the spring, and buyers still largely sitting on the sidelines, we could see inventory continue to build in the coming months. However, if mortgage rates continue to trend downward, that could be the catalyst that brings buyers back into the market in a big way. As always, real estate is a highly localized asset, which is why you should check out what's going on in your local market below in the Local Lowdown!
Big Story Data
The Local Lowdown
Quick Take:
-
Single-family home prices in Alameda County bounced back to $1.3 million, while condo prices remain mixed with a notable rebound in Contra Costa County.
-
Inventories remain more than 20% below last year's levels for single-family homes, keeping the market tight heading into spring.
-
Listings are moving quickly across the board, with single-family homes selling in under two weeks in both counties.
Note: You can find the charts/graphs for the Local Lowdown at the end of this section.
Single-family homes in Alameda County return to the $1.3million mark
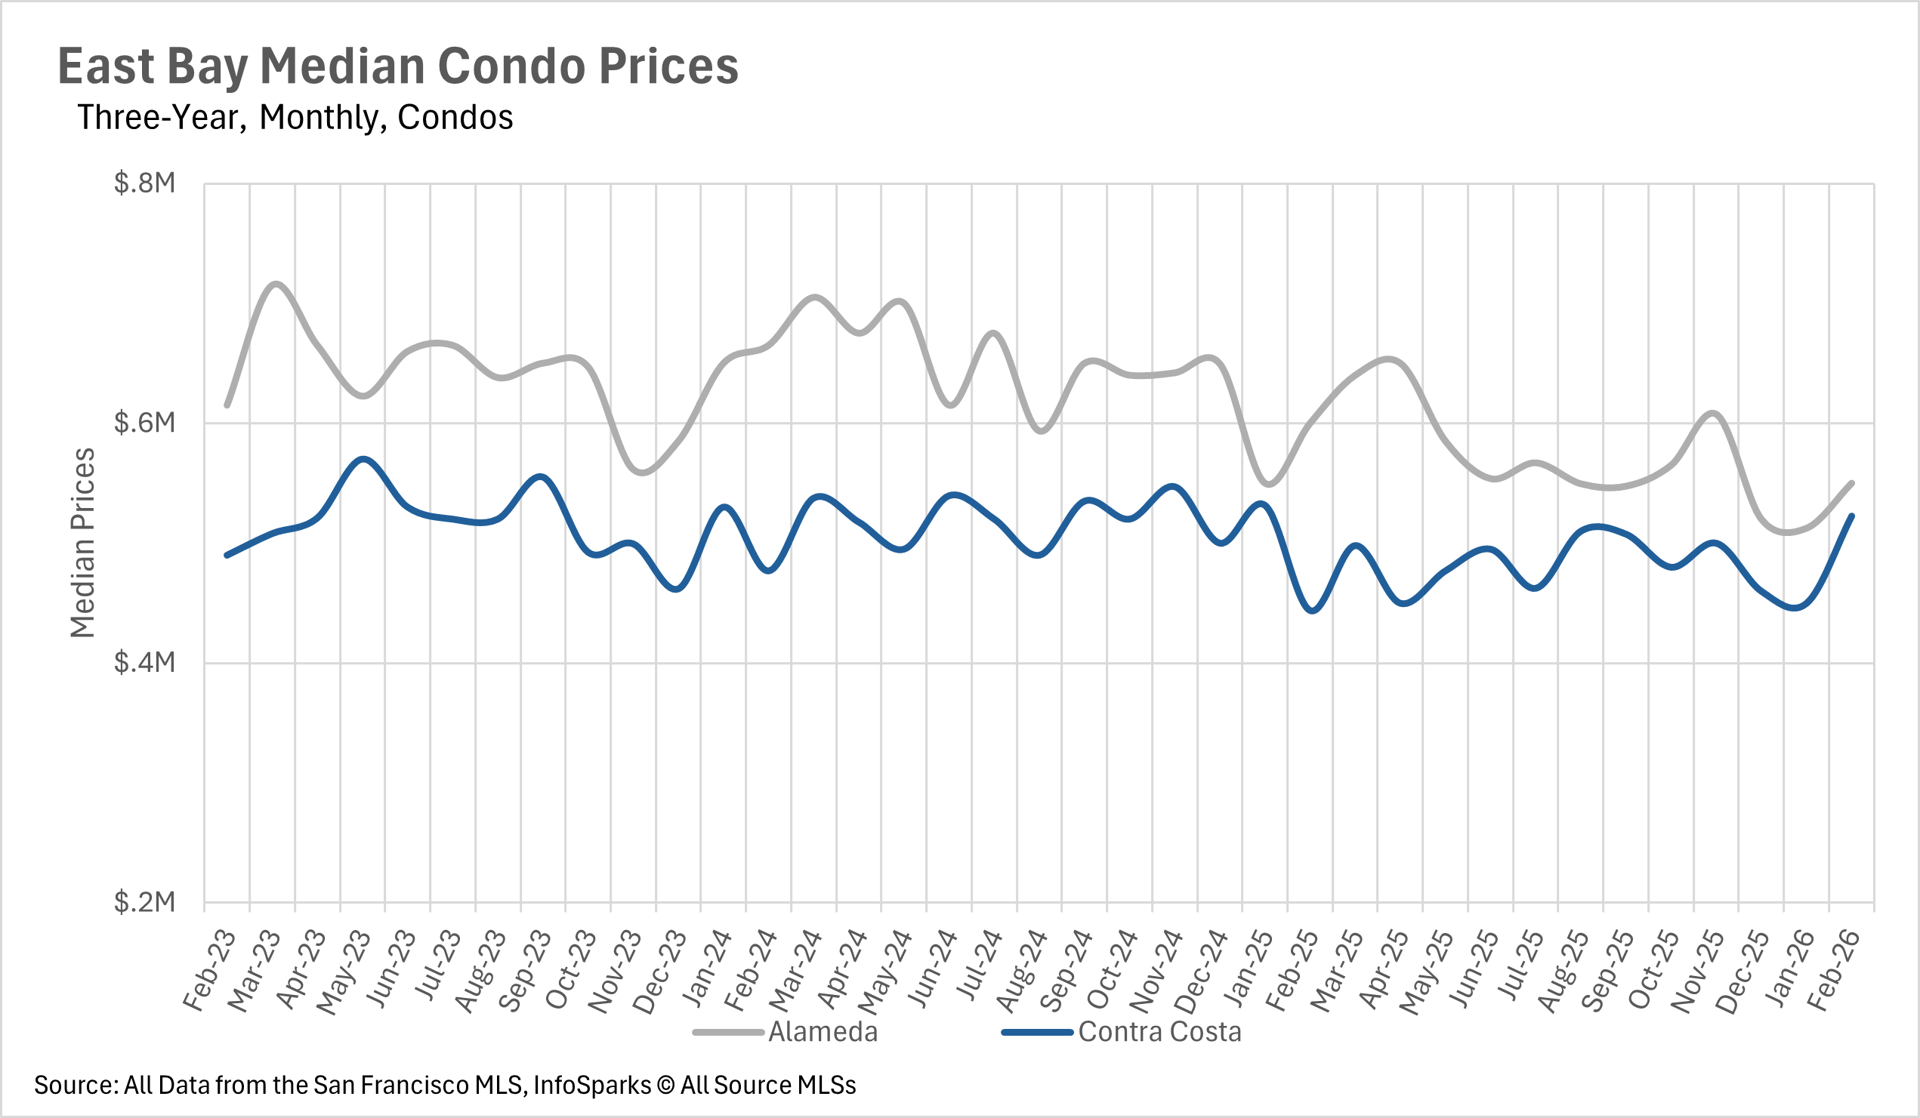
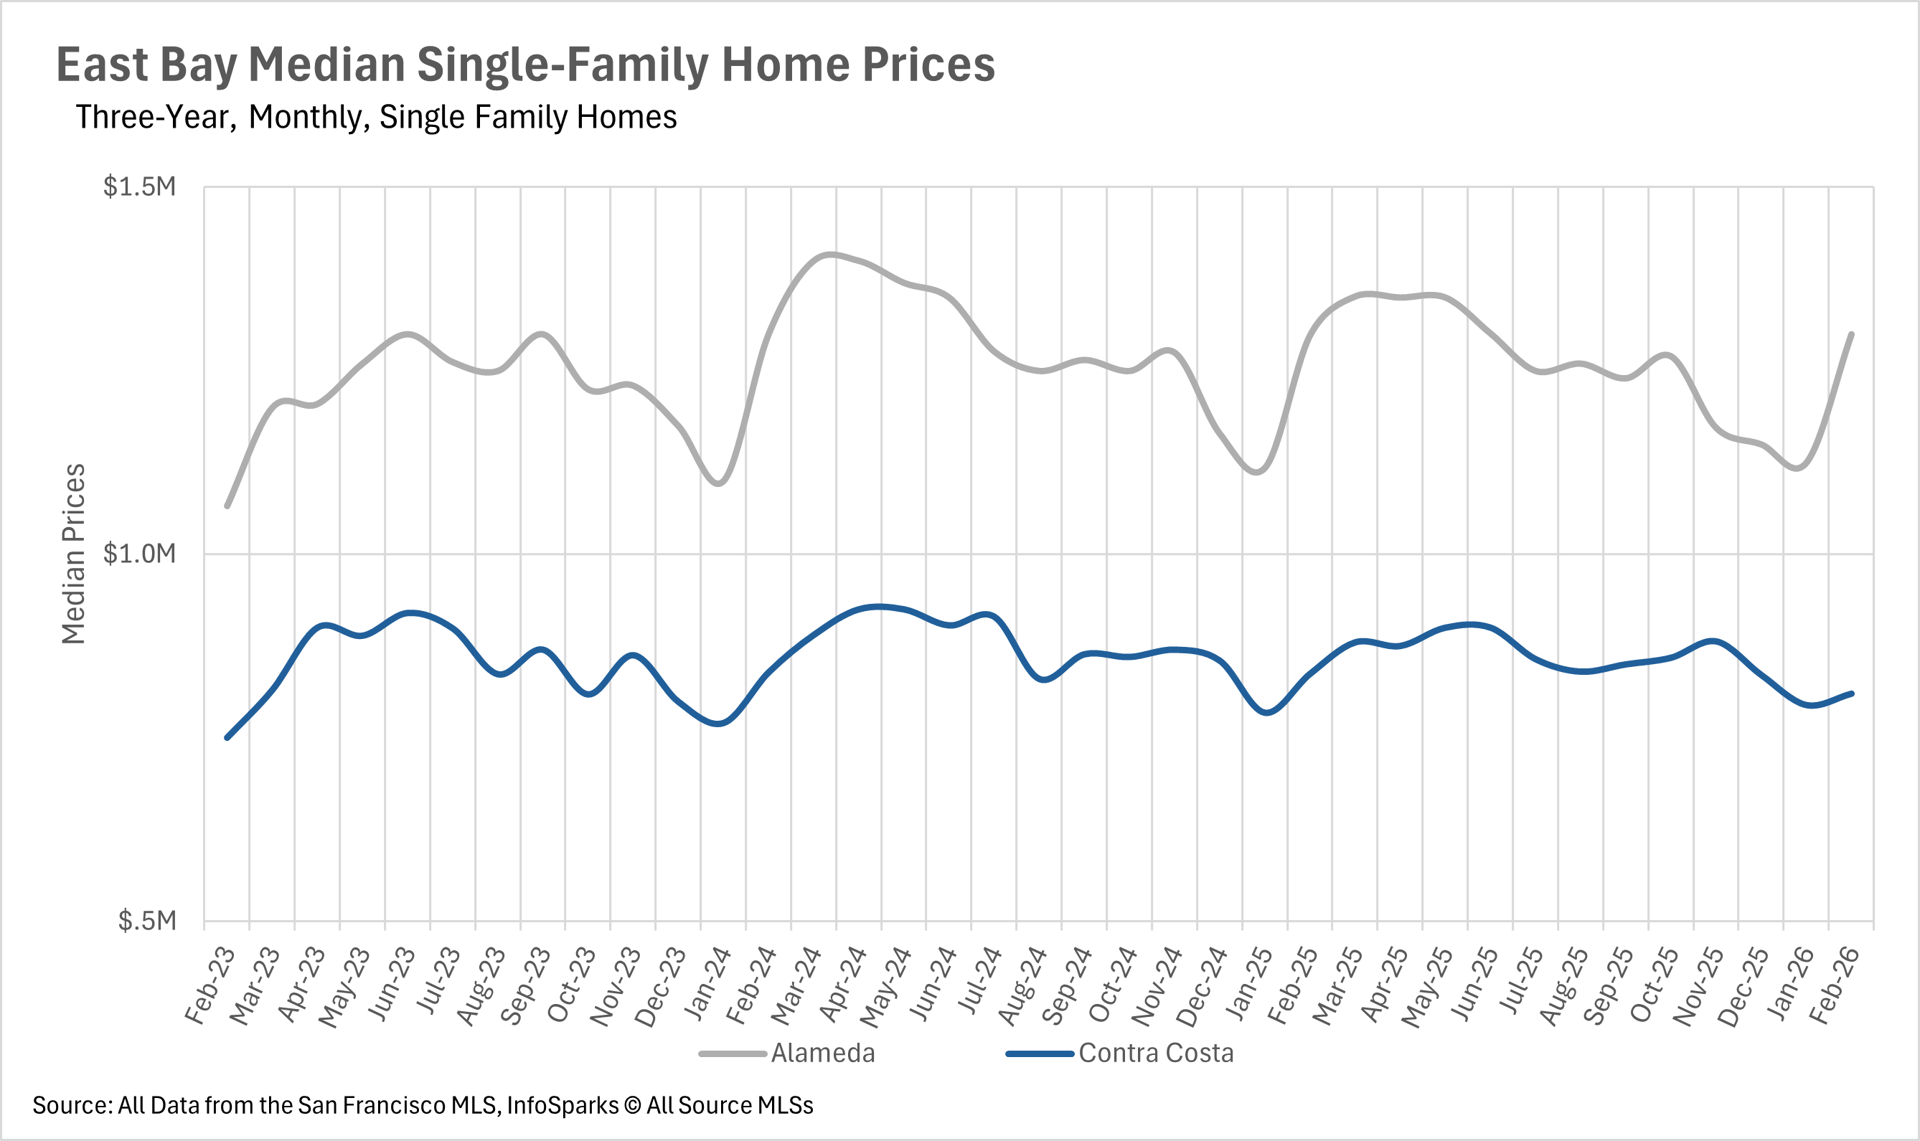
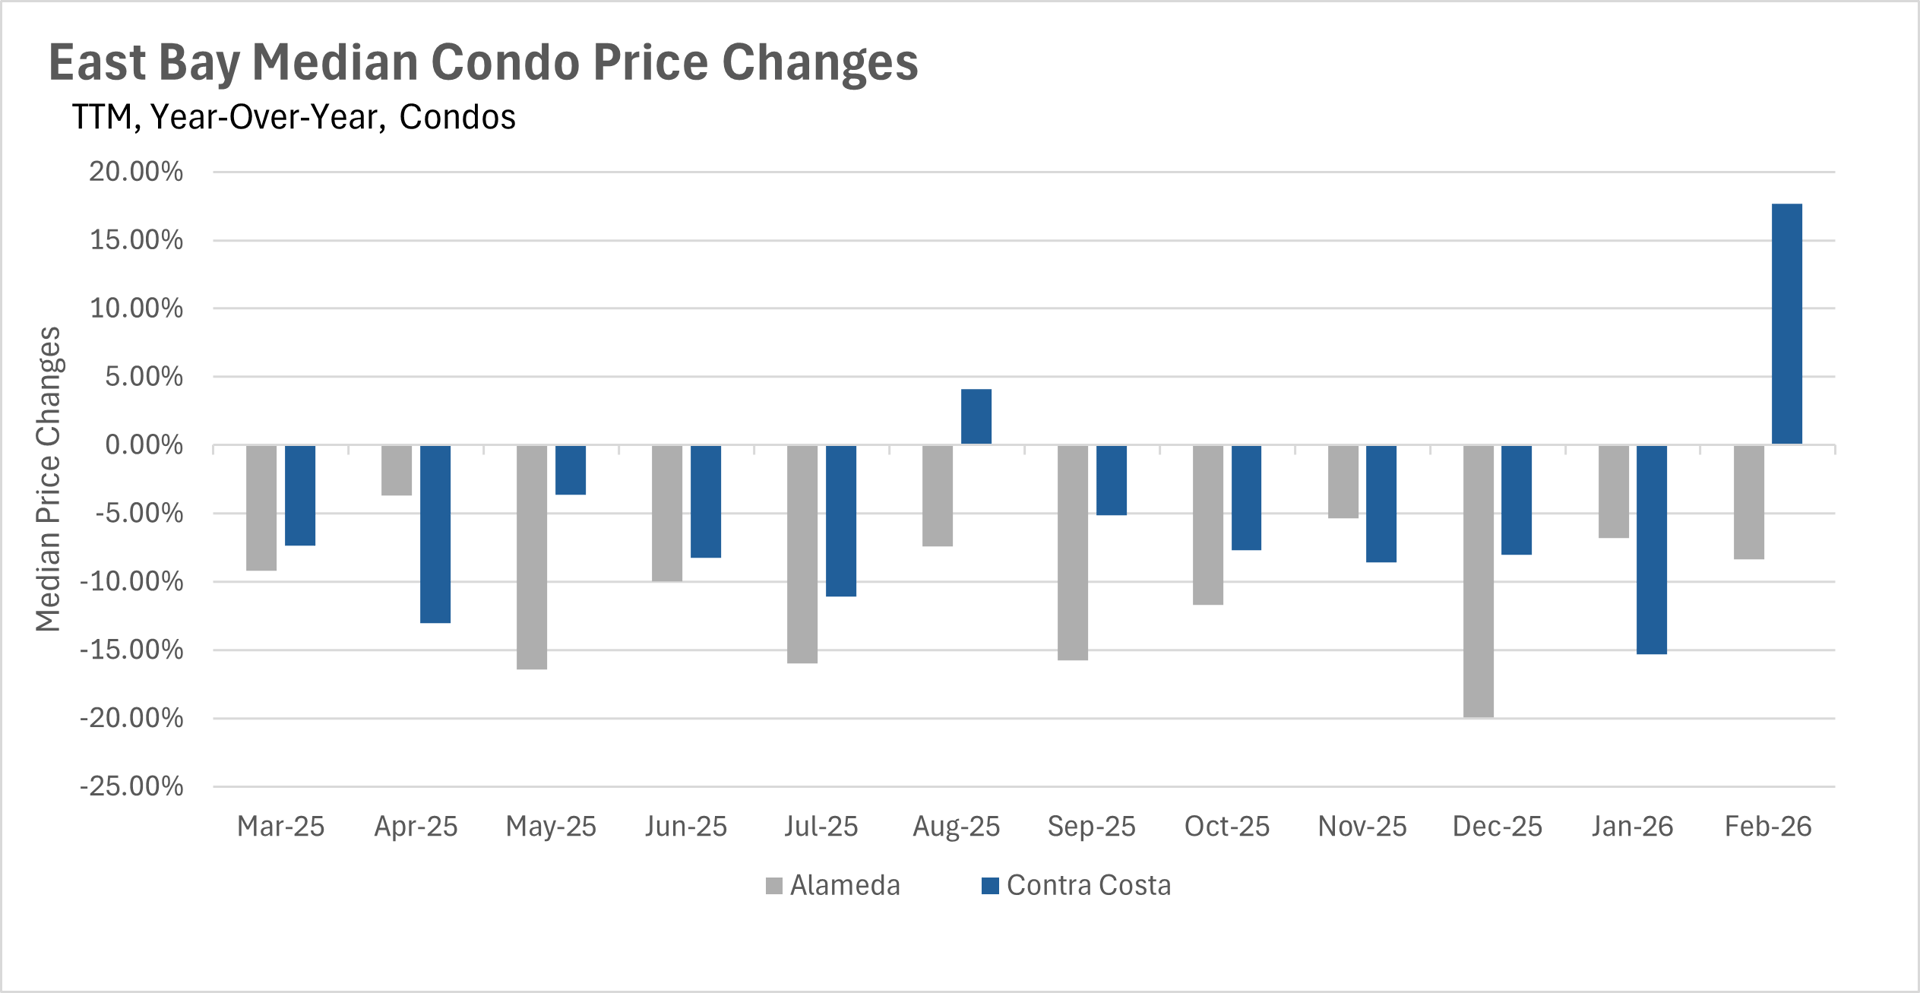
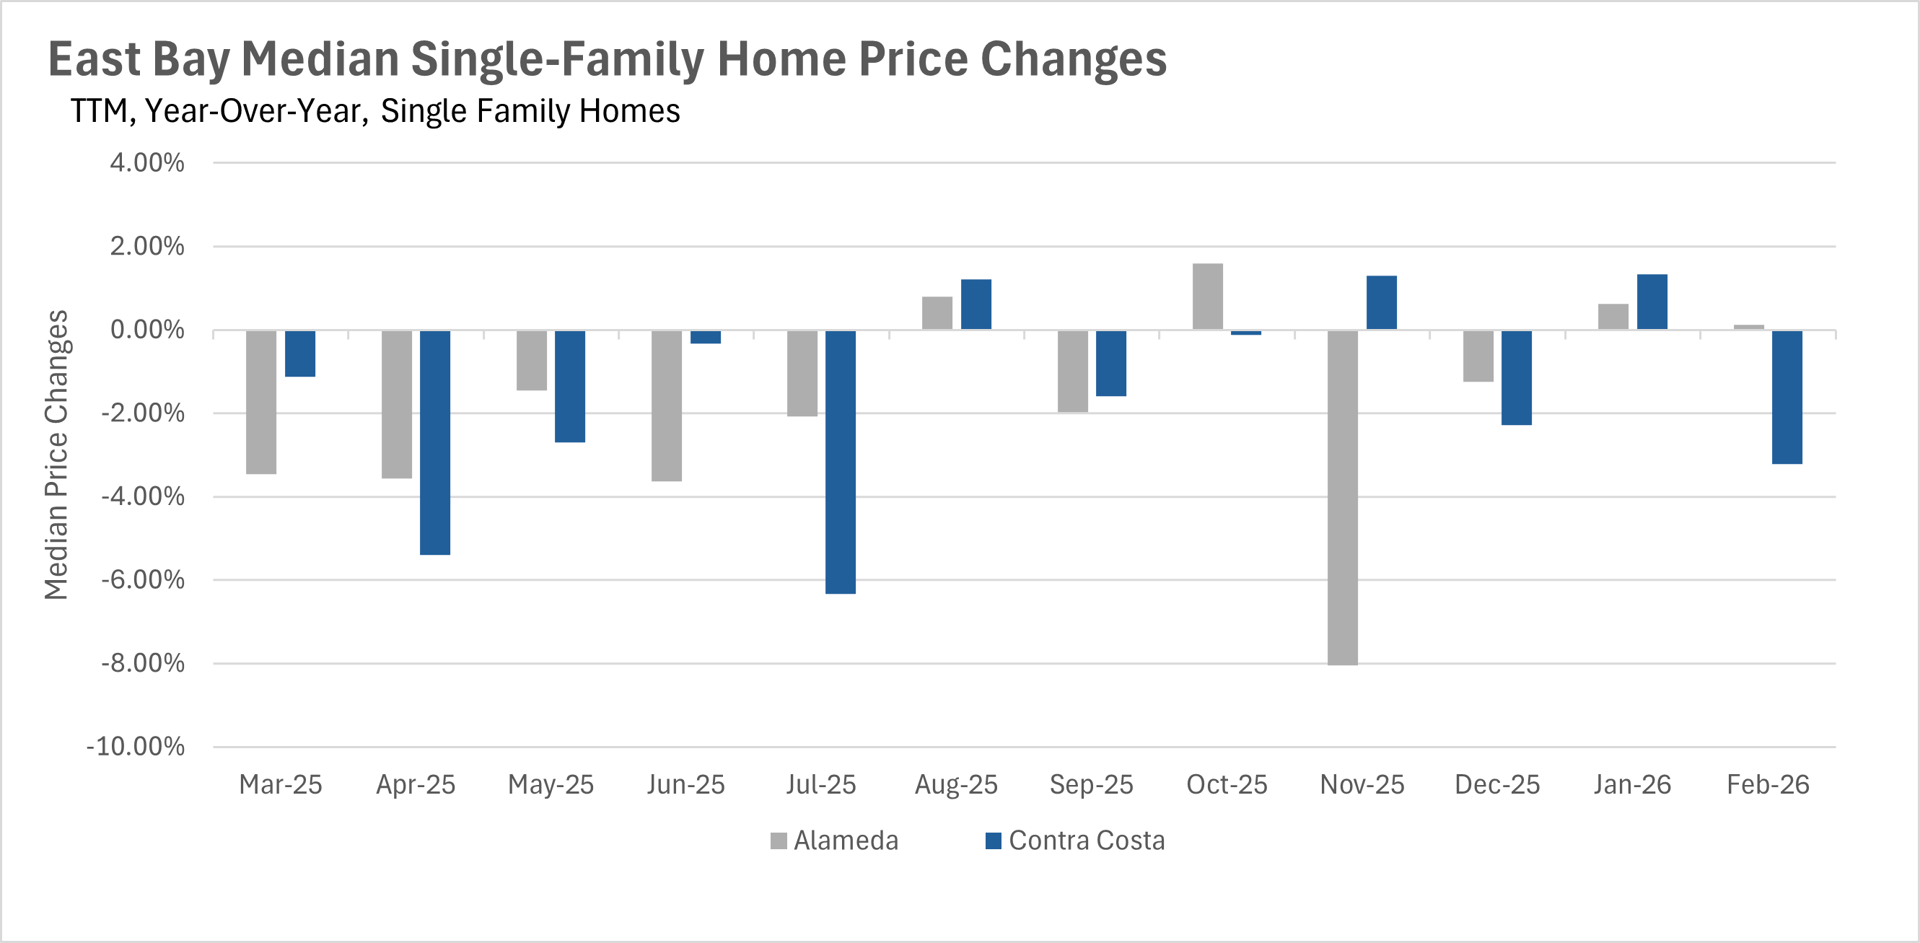
February brought some welcome news for Alameda County homeowners, as the median single-family home sale price climbed back to $1,300,000, essentially flat on a year-over-year basis at +0.12%. Contra Costa County saw a slight decline, with the median single-family home selling for $810,000, representing a 3.23% year-over-year decrease. The condo market presented an interesting split this month. Alameda County condos continued their downward trend, with the median condo selling for $550,000, an 8.33% decline compared to last year. However, Contra Costa County condos saw a significant rebound, with the median sale price jumping to $522,500, a 17.68% year-over-year increase. This volatility in the condo market is not unusual, as the smaller number of transactions can lead to larger swings in median prices from month to month.
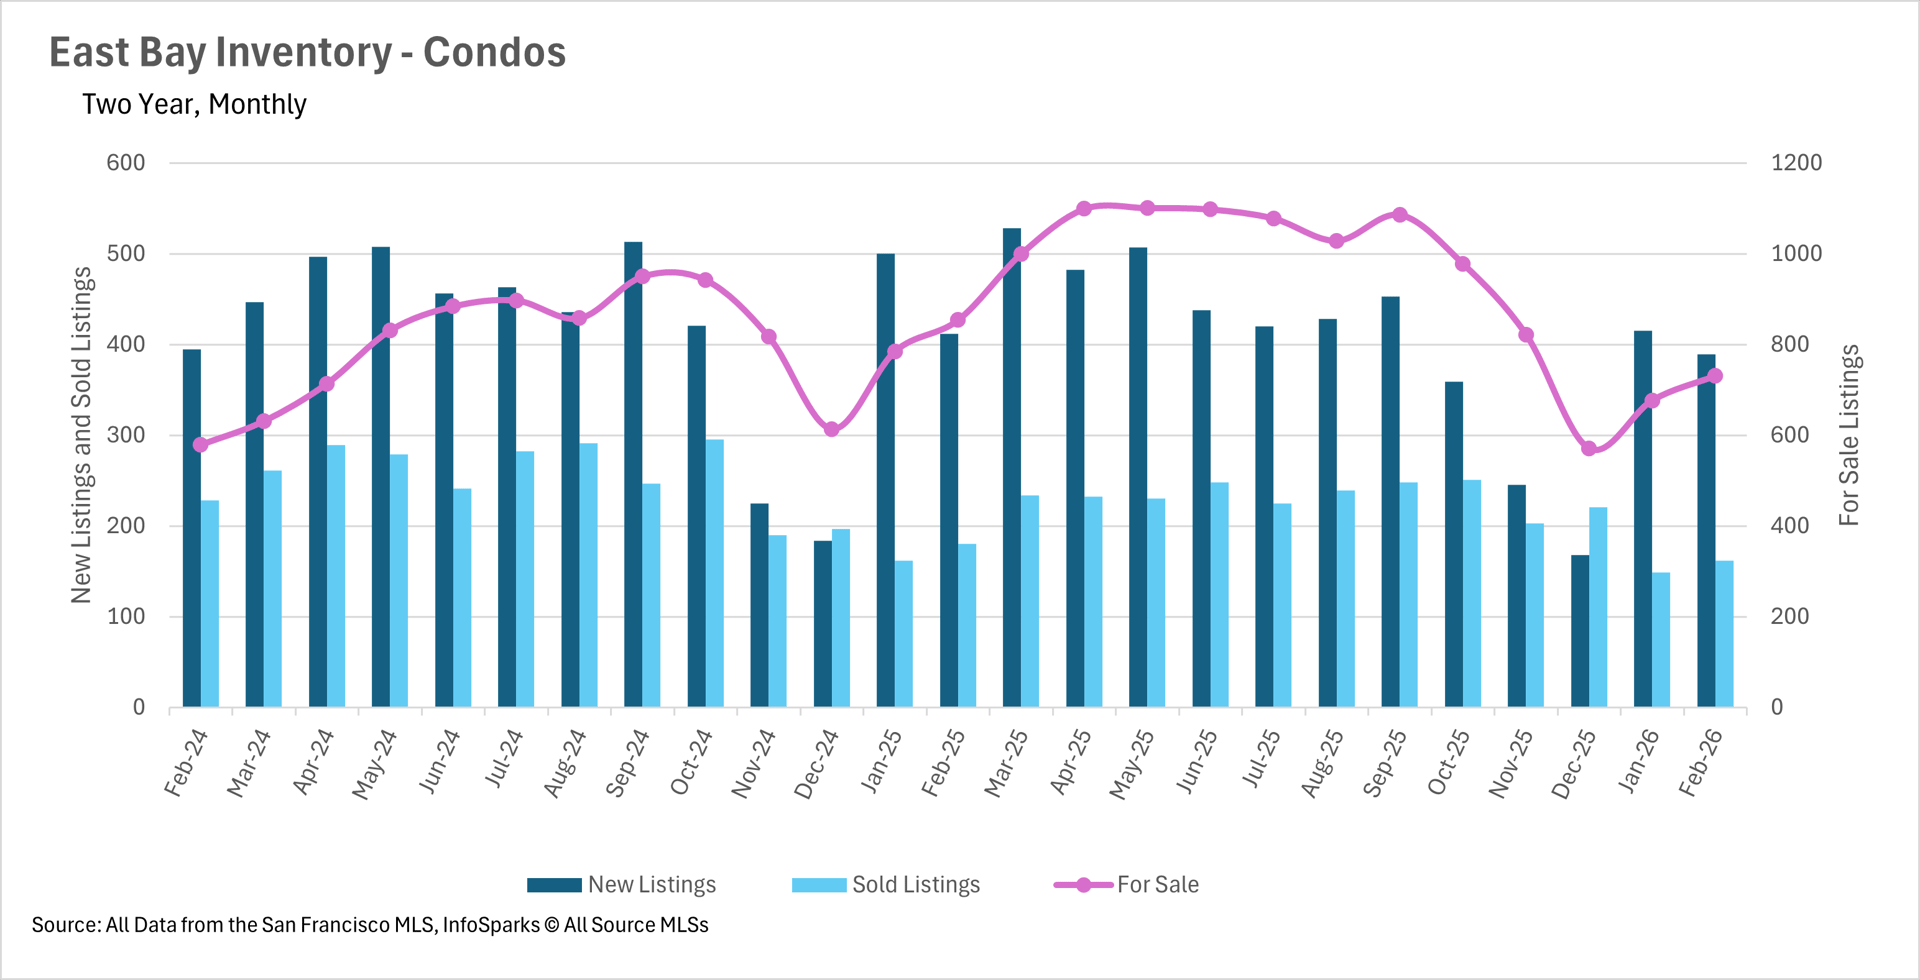
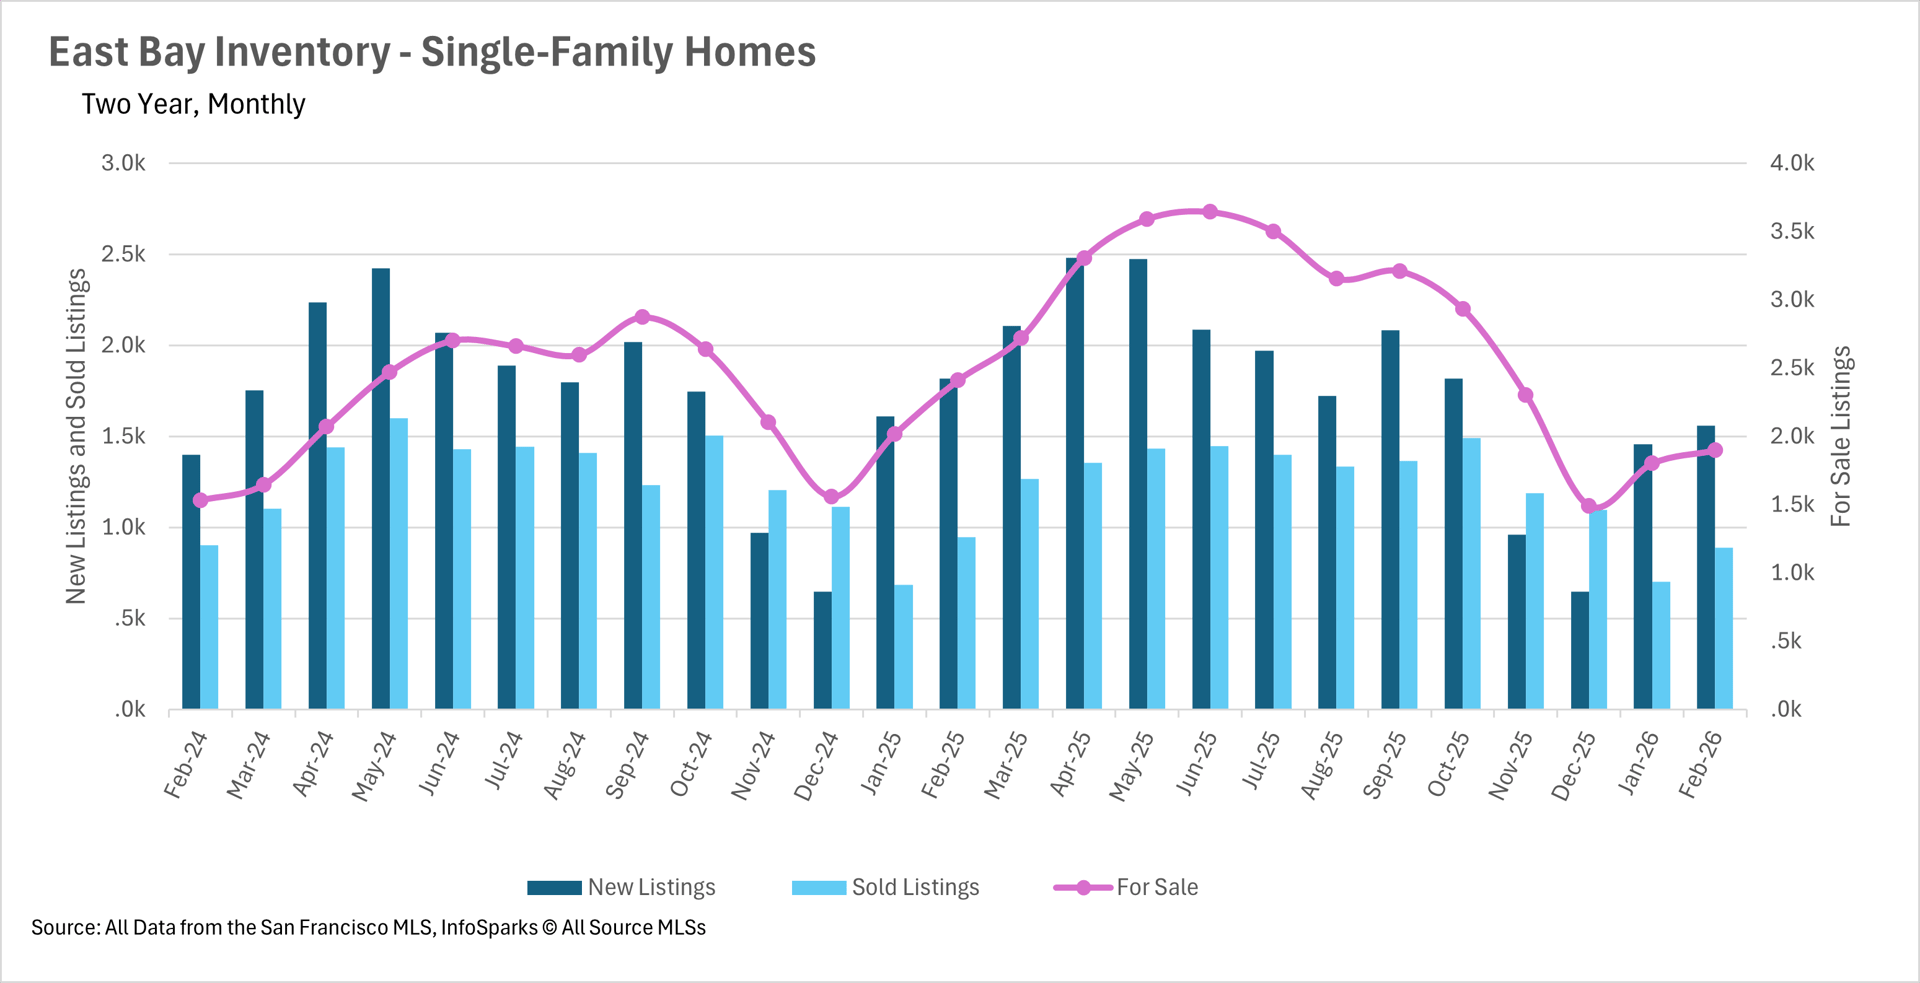
Inventory remains constrained as spring approaches
As we move into the spring selling season, inventory levels in the East Bay remain well below where they were a year ago. Single-family home inventory stood at just 1,898 units in February, representing a 21.24% decline on a year-over-year basis. The condo market saw a similar trend, with inventory down 14.40% to just 731 units. This persistent lack of inventory continues to be a defining feature of the East Bay market and is likely contributing to the relative stability in single-family home prices. As we move deeper into spring, we'll be watching closely to see whether new listings can keep pace with buyer demand.
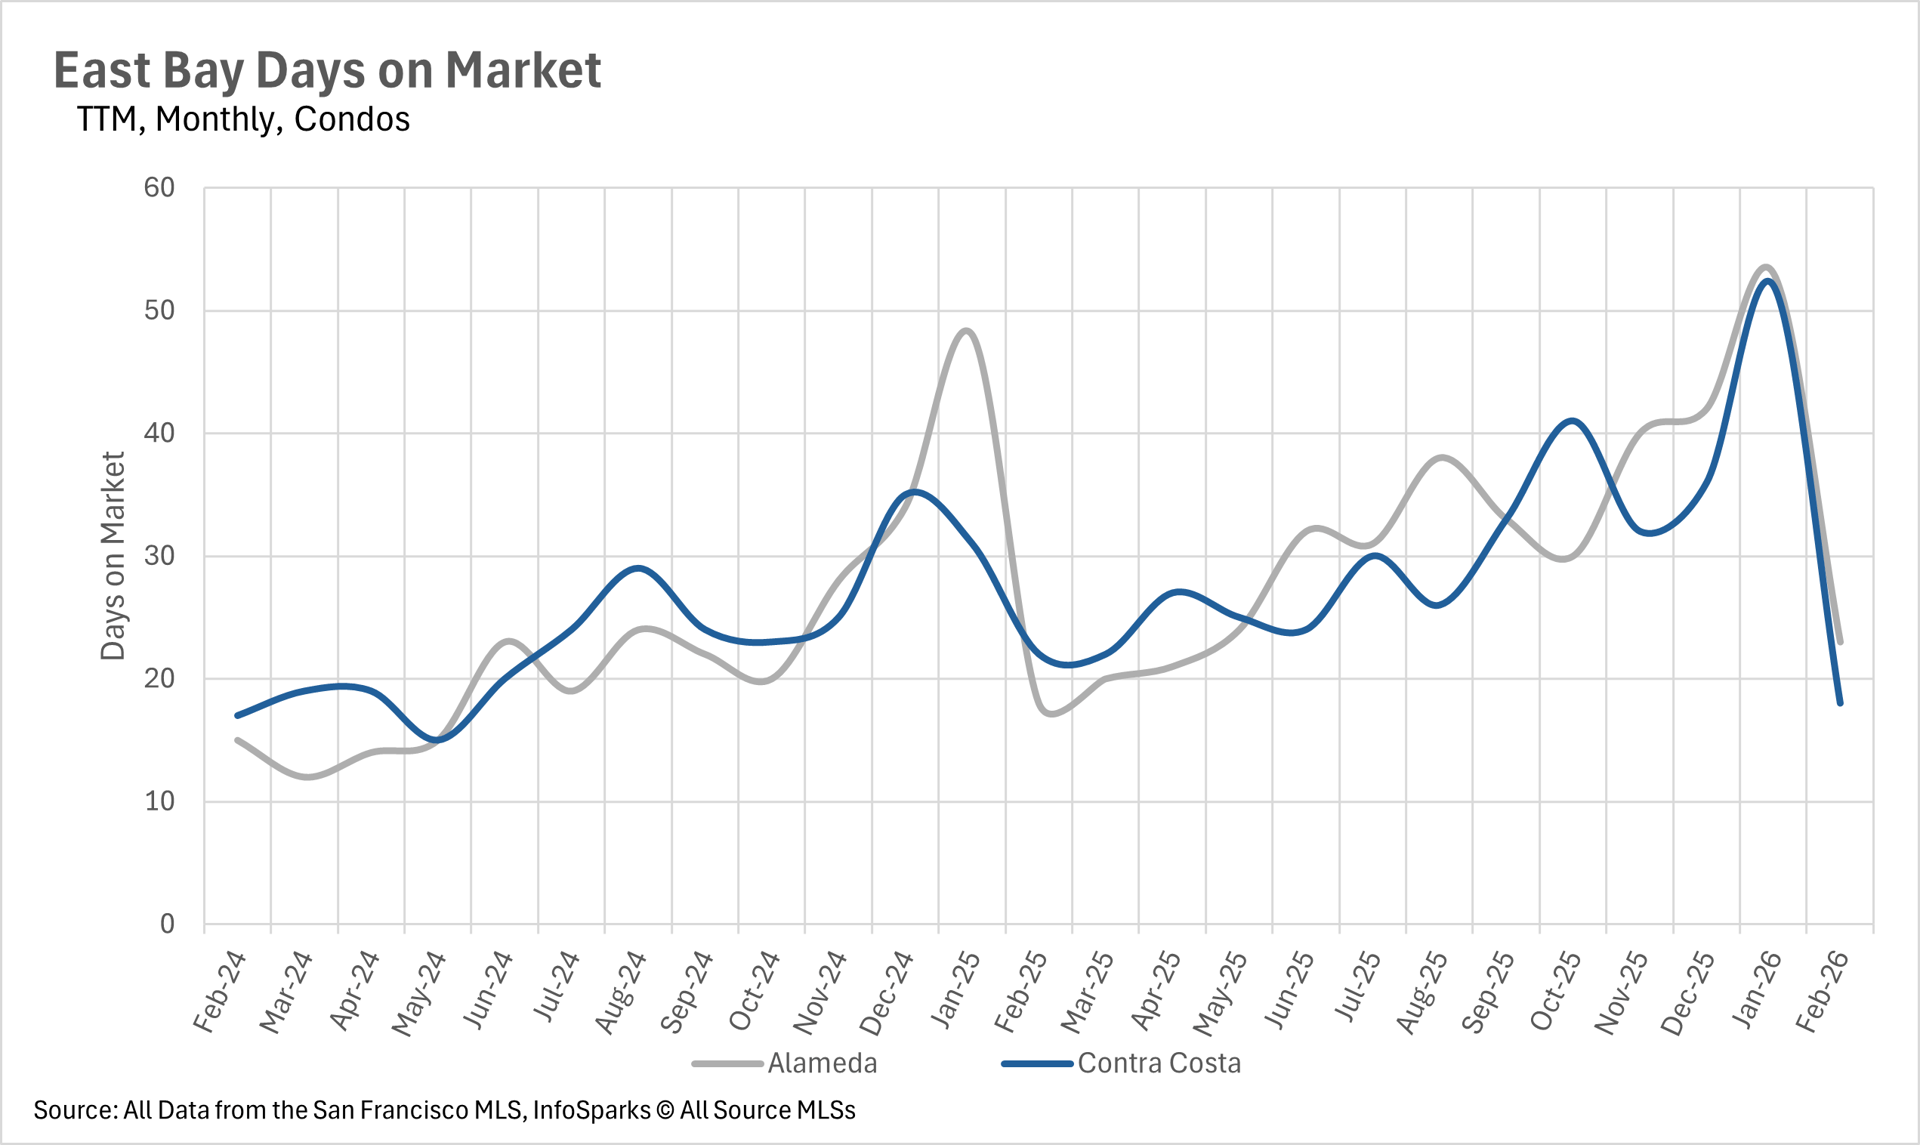
Homes are flying off the shelves as the spring market heats up
The pace of sales picked up considerably in February, with single-family homes selling remarkably quickly across both counties. The average single-family home in Alameda County sold in just 13 days, while homes in Contra Costa County sold in just 14 days. While these figures represent year-over-year increases of 18.18% and 16.67% respectively, listings are still moving at a very brisk pace by historical standards. The condo market also saw improved velocity, with the average condo in Alameda County selling in 23 days and Contra Costa County condos selling in just 18 days. This represents a sharp month-over-month improvement, as buyers appear to be taking advantage of the spring selling season.
The single-family market remains firmly in seller's territory
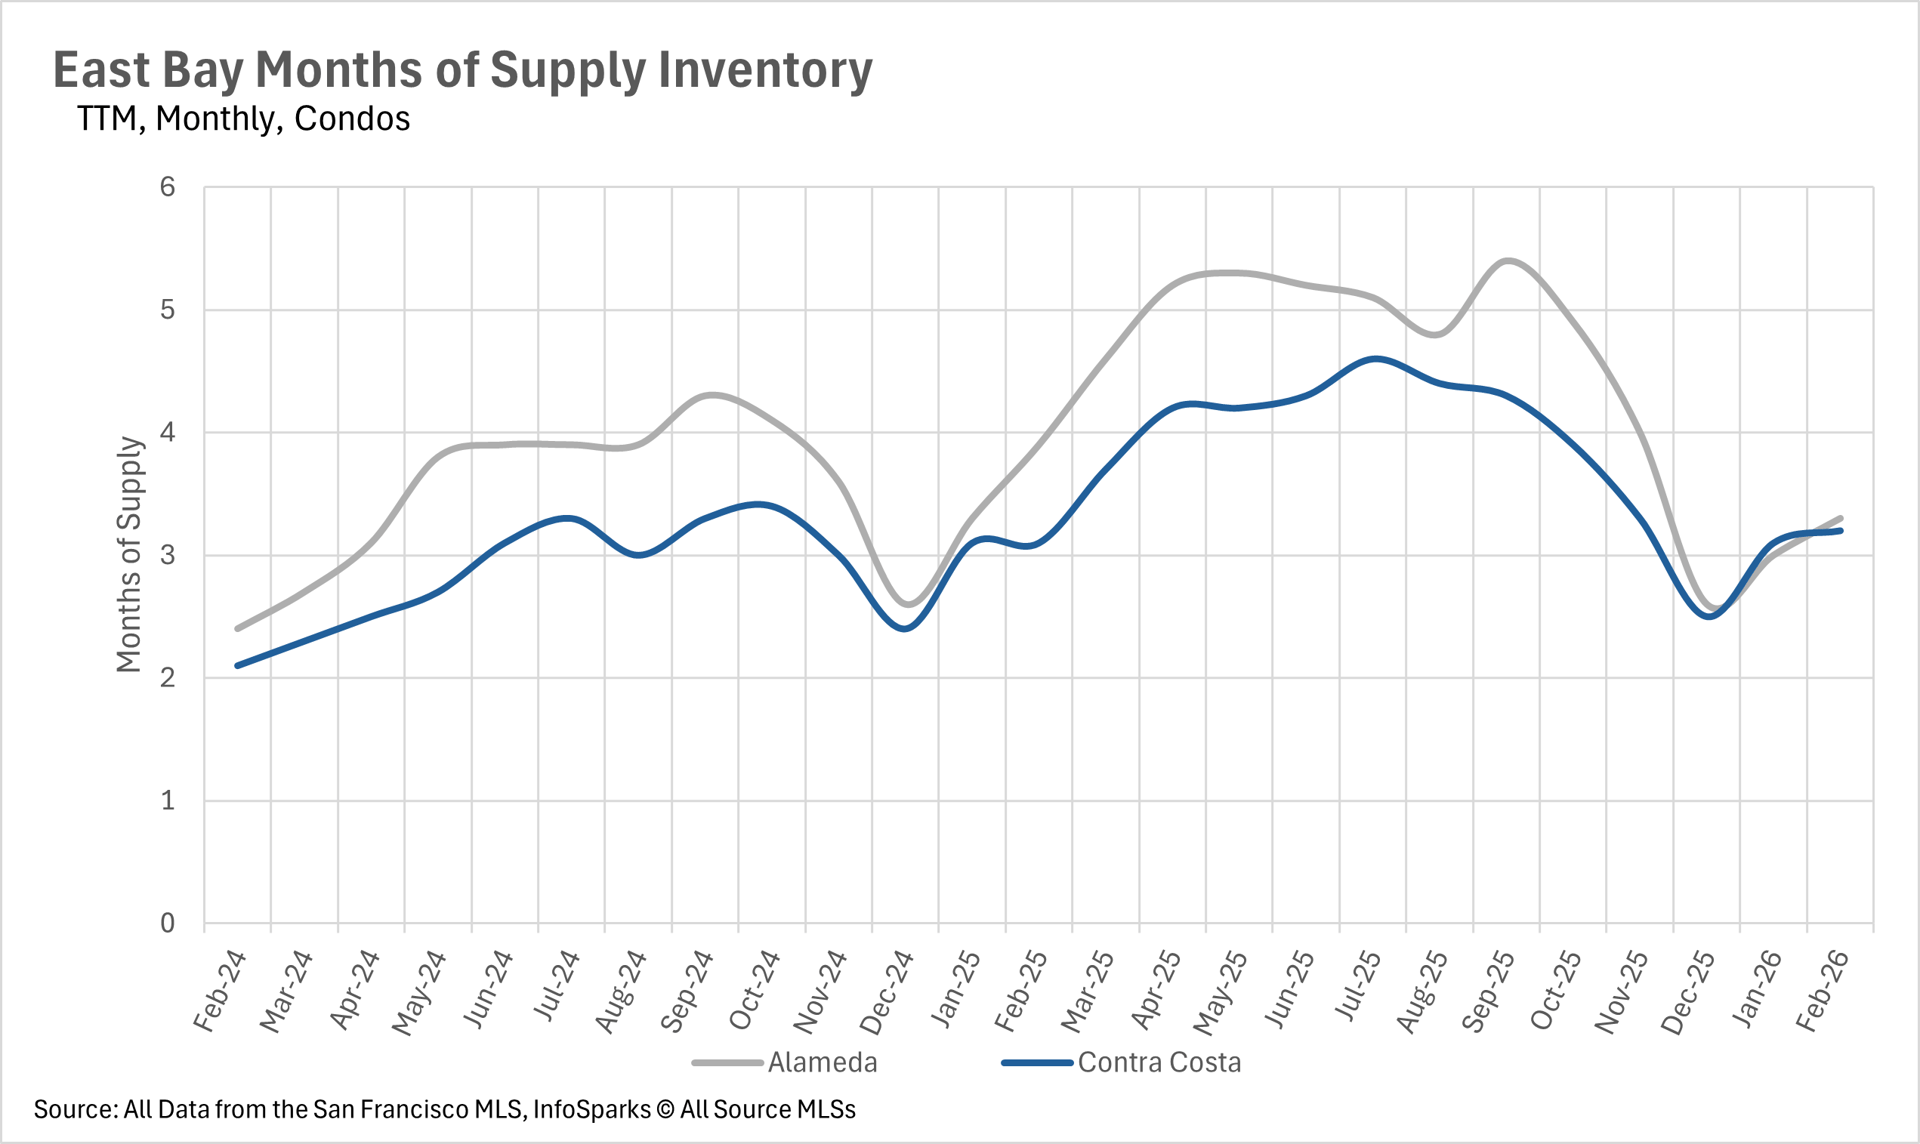
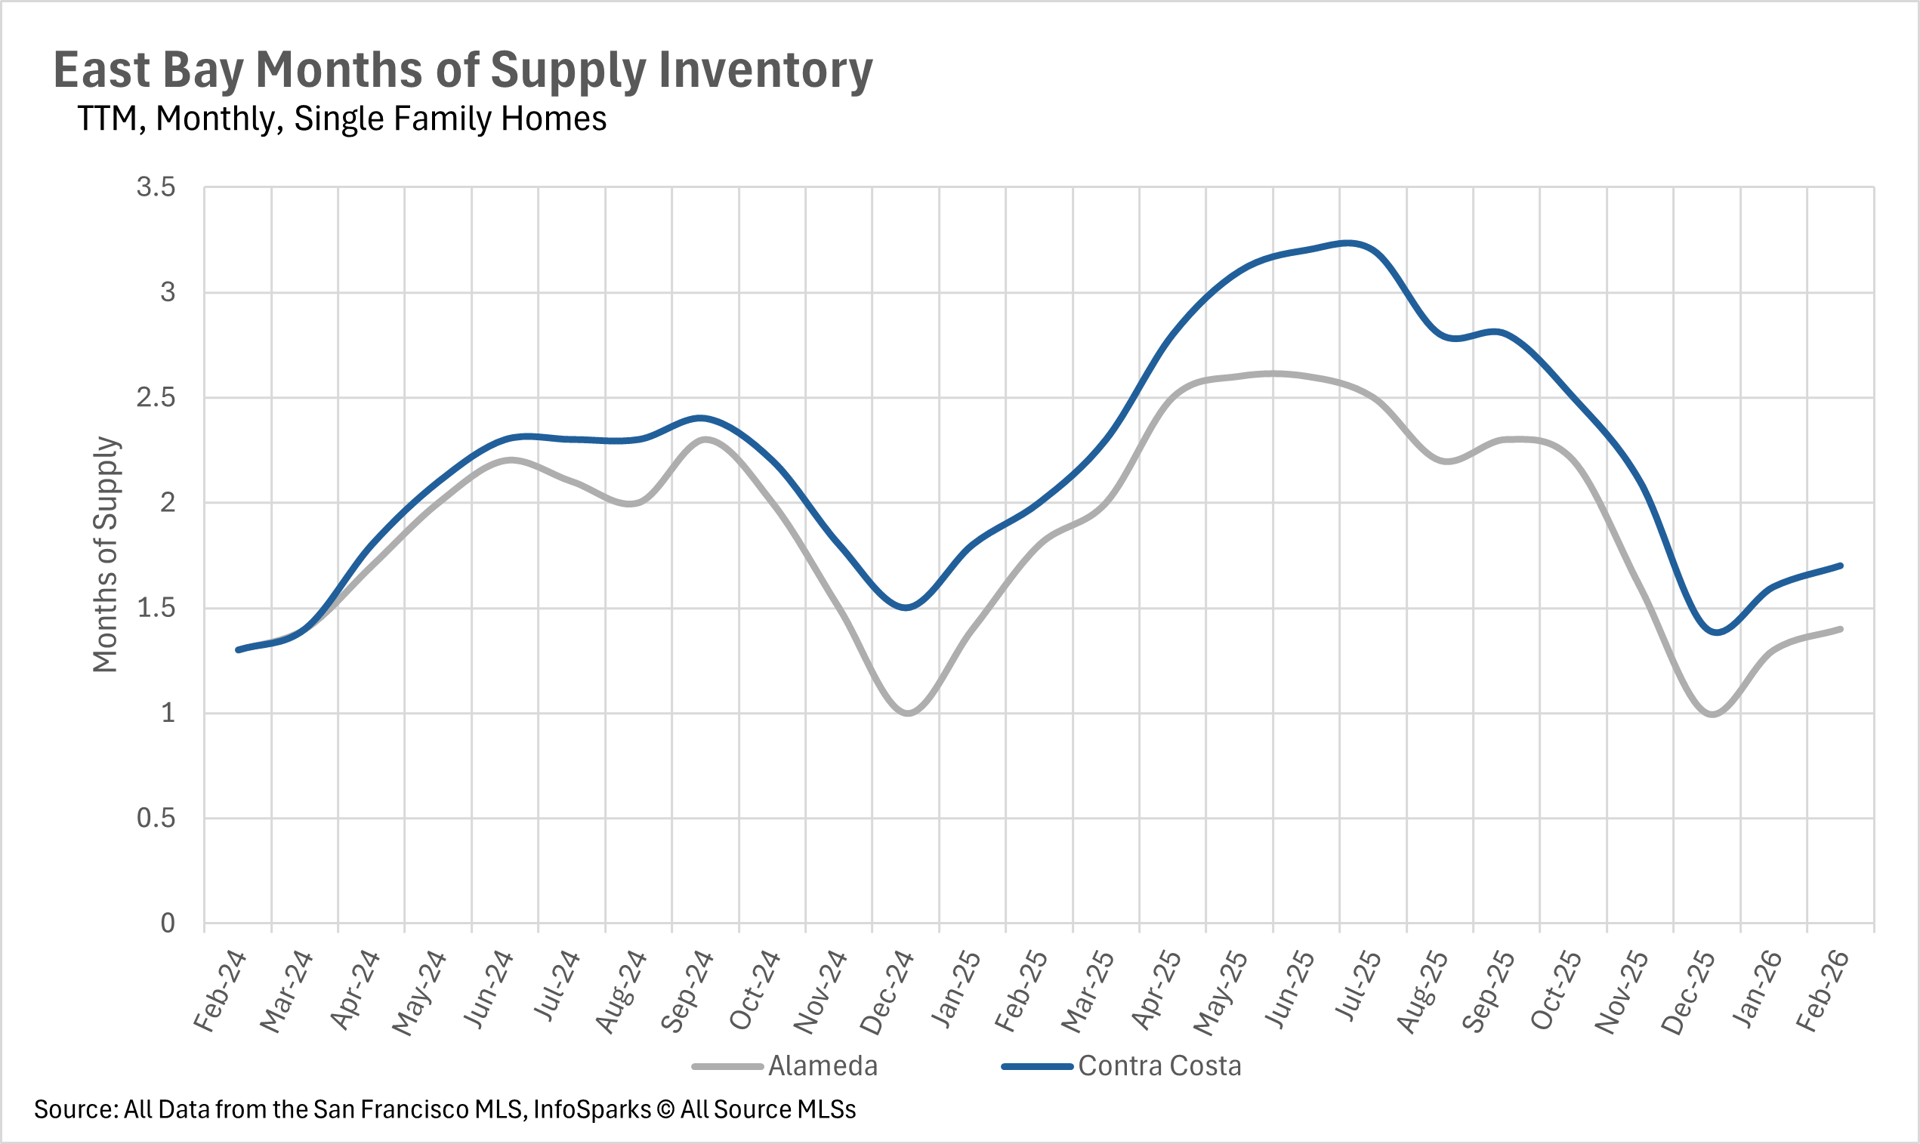
When determining whether a market is a buyers' market or a sellers' market, we look to the Months of Supply Inventory (MSI) metric. The state of California has historically averaged around three months of MSI, so any area with at or around three months of MSI is considered a balanced market. Any market that has lower than three months of MSI is considered a seller's market, whereas markets with more than three months of MSI are considered buyers' markets.
The single-family home market remains a strong seller's market, with just 1.4 months of inventory in Alameda County and 1.7 months in Contra Costa County. These figures represent year-over-year declines of 22.22% and 15.00%, respectively, indicating that competition among buyers remains fierce. The condo market, on the other hand, has shifted into more balanced territory. Alameda County ended February with 3.3 months of condo inventory, while Contra Costa County had 3.2 months. This places the condo market right around the historical average for California, giving both buyers and sellers relatively equal footing in negotiations.
Local Lowdown Data