The Big Story
Quick Take:
-
Median home sale prices are virtually flat on a year-over-year basis, as the market has settled into a holding pattern despite lower mortgage rates.
-
Inventory levels remain slightly elevated compared to last year, but the gap continues to narrow.
-
Existing home sales have pulled back on both a month-over-month and year-over-year basis, signaling that buyers are still waiting on the sidelines.
Note: You can find the charts & graphs for the Big Story at the end of the following section.
*National Association of REALTORS® data is released two months behind, so we estimate the most recent month’s data when possible and appropriate.
Low rates are finally making homeownership more affordable!
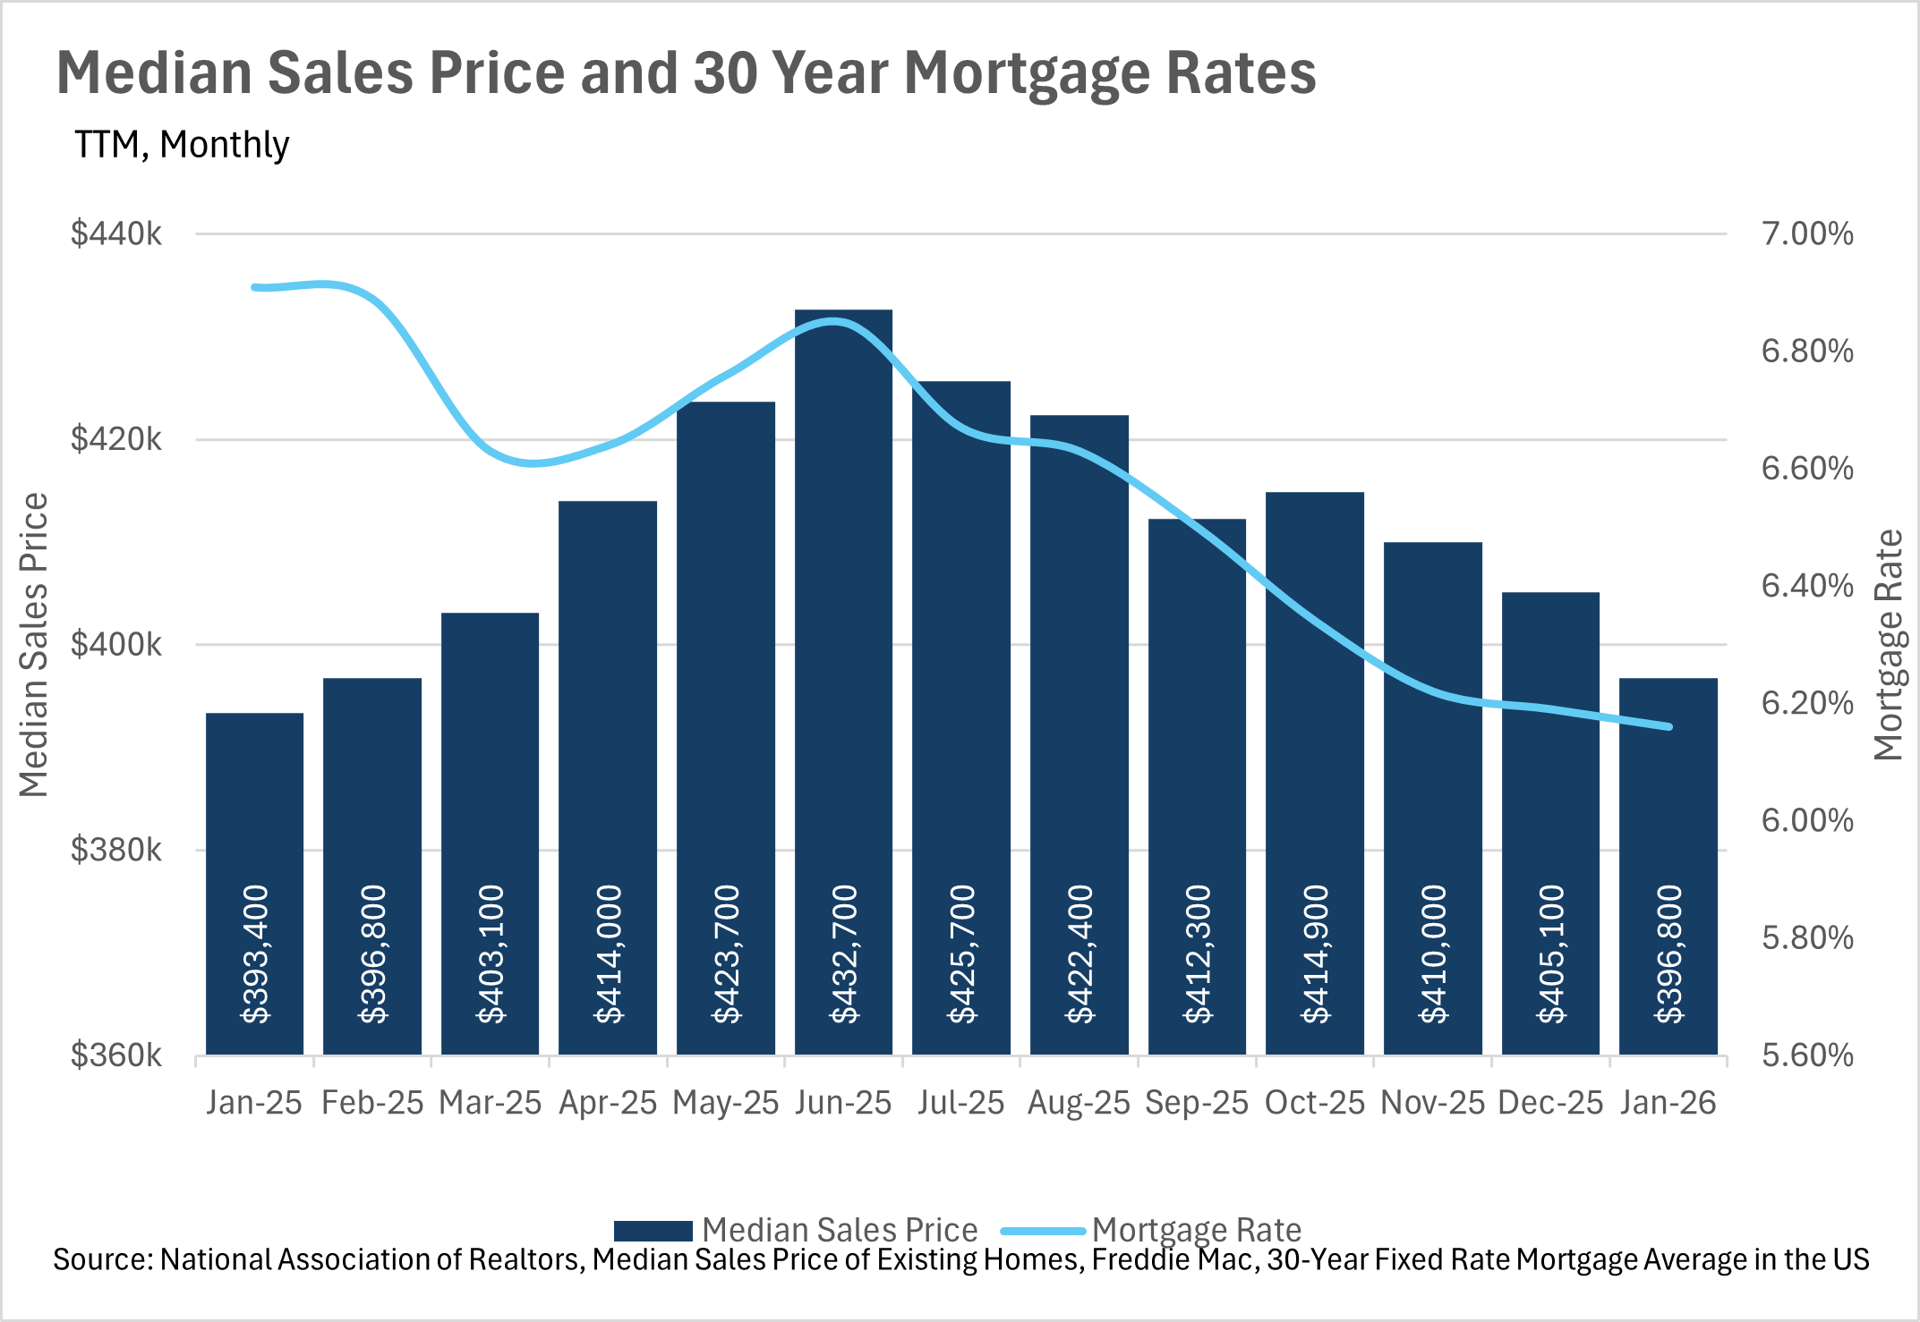
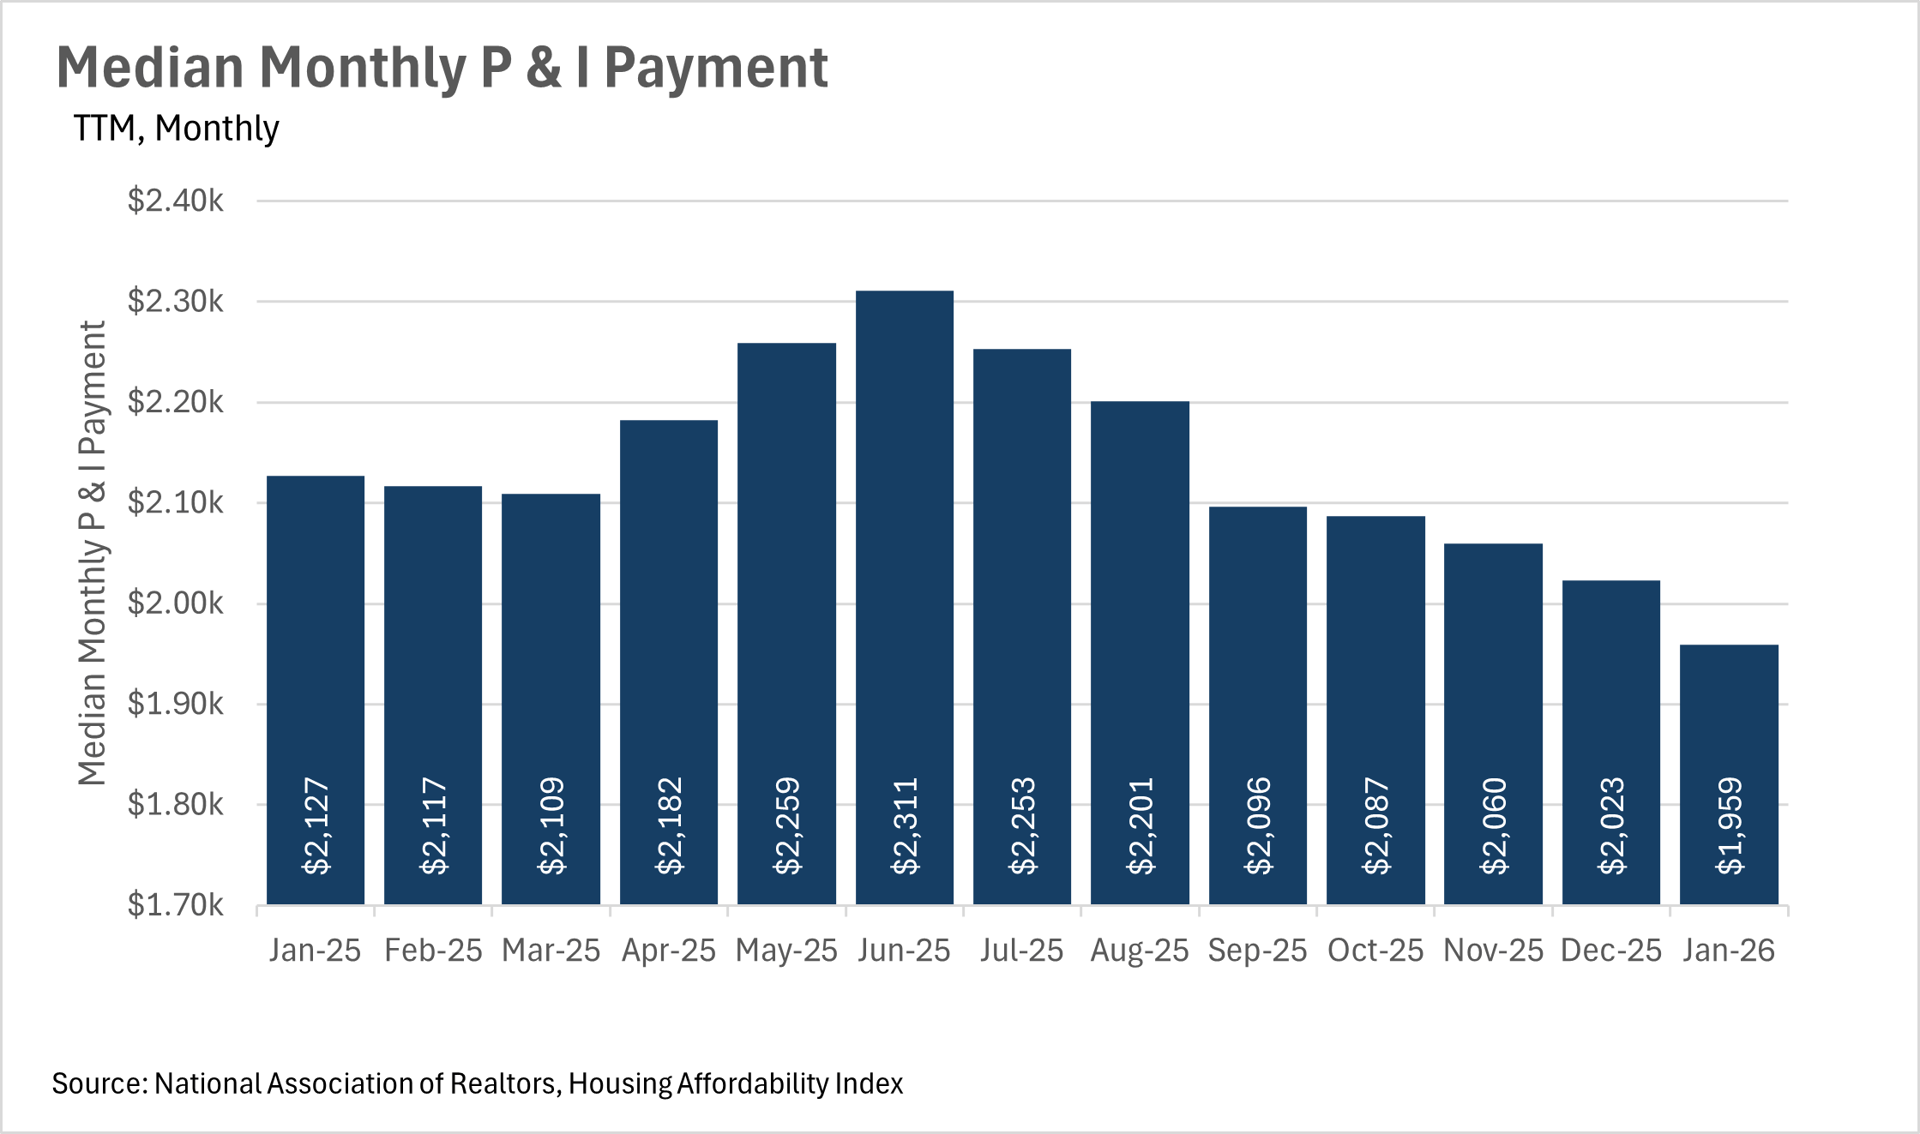
One of the biggest stories in the housing market right now is the continued decline in mortgage rates, and what that means for the average homebuyer's wallet. The average 30-year mortgage rate sat at 6.16% in January, representing a 10.85% year-over-year decline from the 6.91% we were seeing just a year ago. This decline in rates has had a direct impact on monthly payments, with the median monthly P&I payment coming in at $1,959 in January, down 7.90% from the $2,127 that the median homeowner was paying this time last year. That's roughly $168 per month in savings, which is great news for the average American.
However, despite the fact that rates have come down substantially, the median home sale price has remained remarkably stable, coming in at $396,800 in January. This represents just a 0.86% increase on a year-over-year basis, and a 2.05% decline from December. It seems like the market has found a bit of equilibrium, as lower rates are being offset by cautious buyers who aren't quite ready to jump back in just yet.
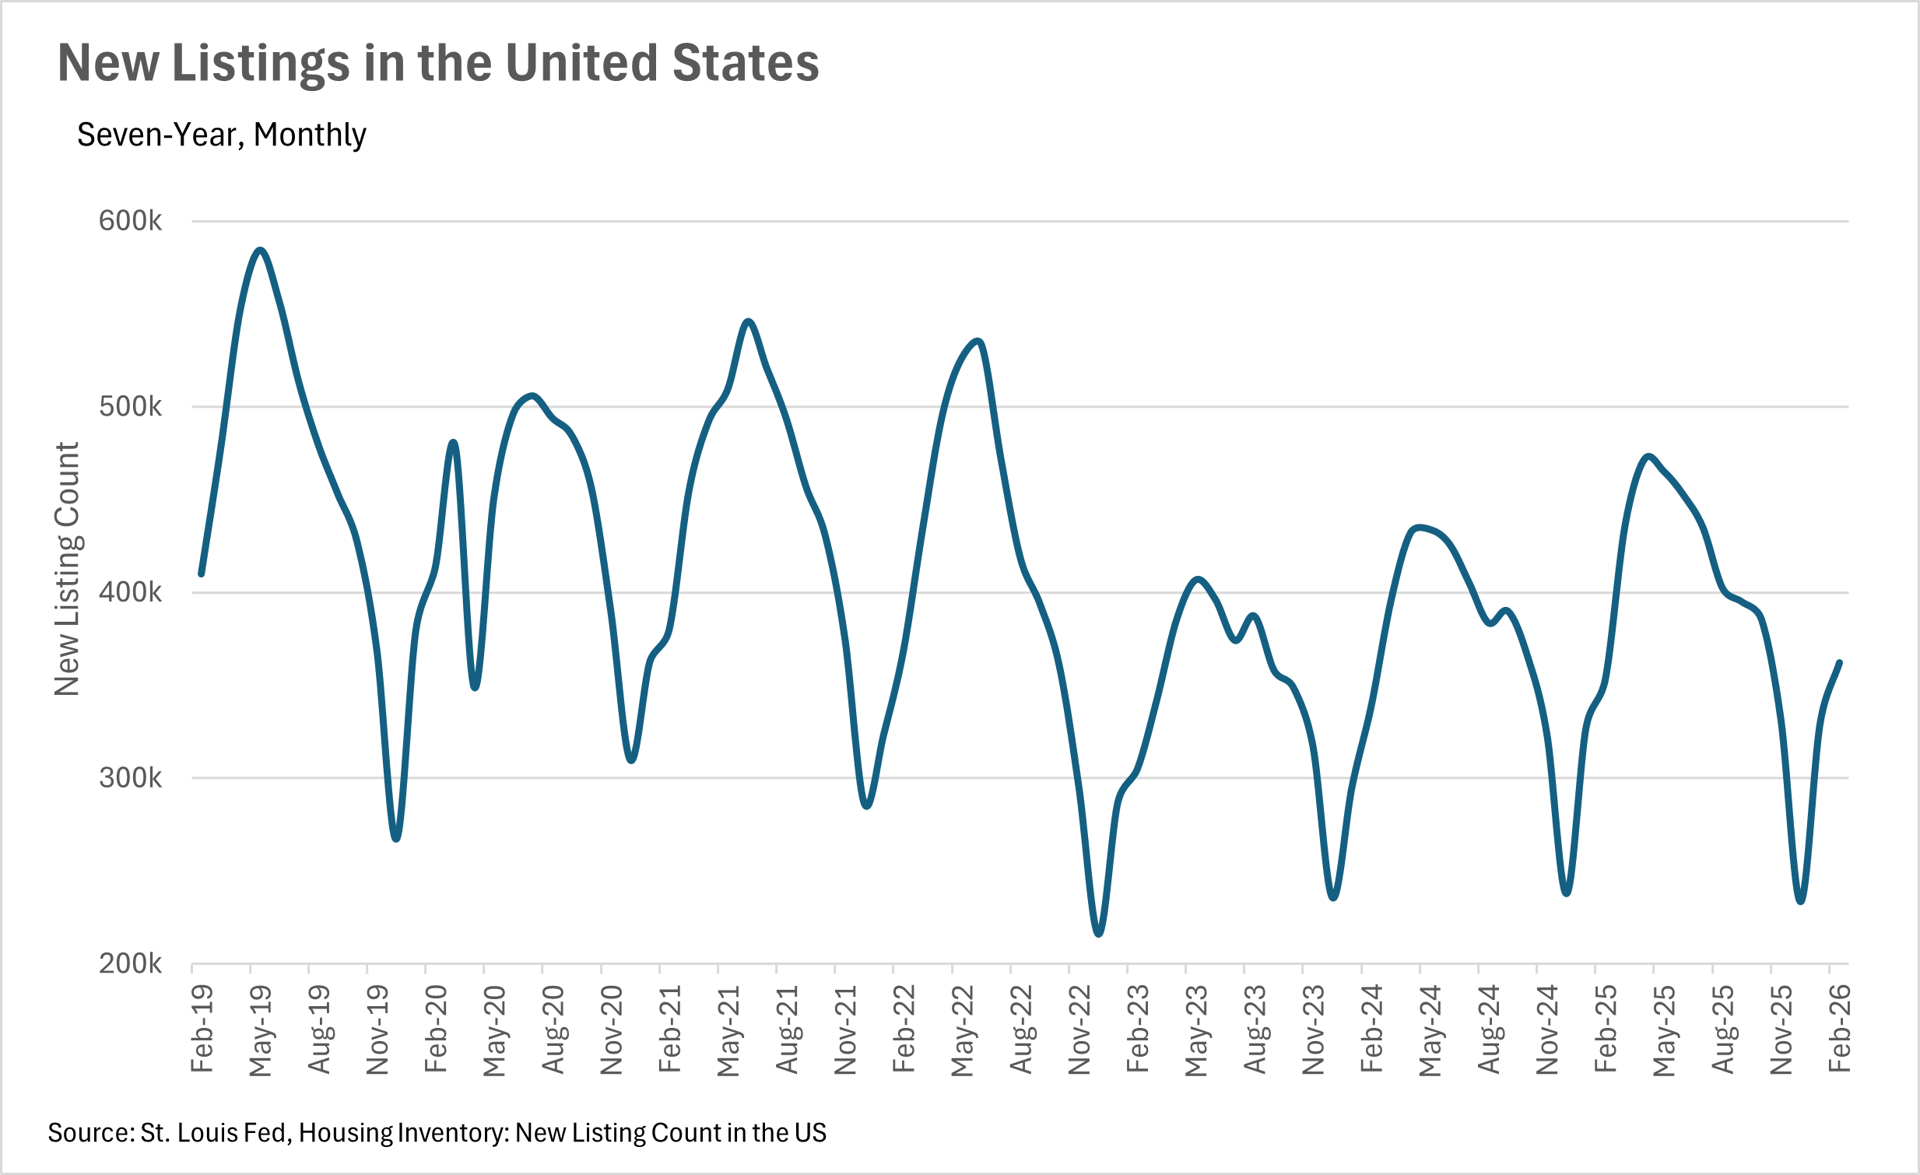
New listings are ticking up as we head into the spring.
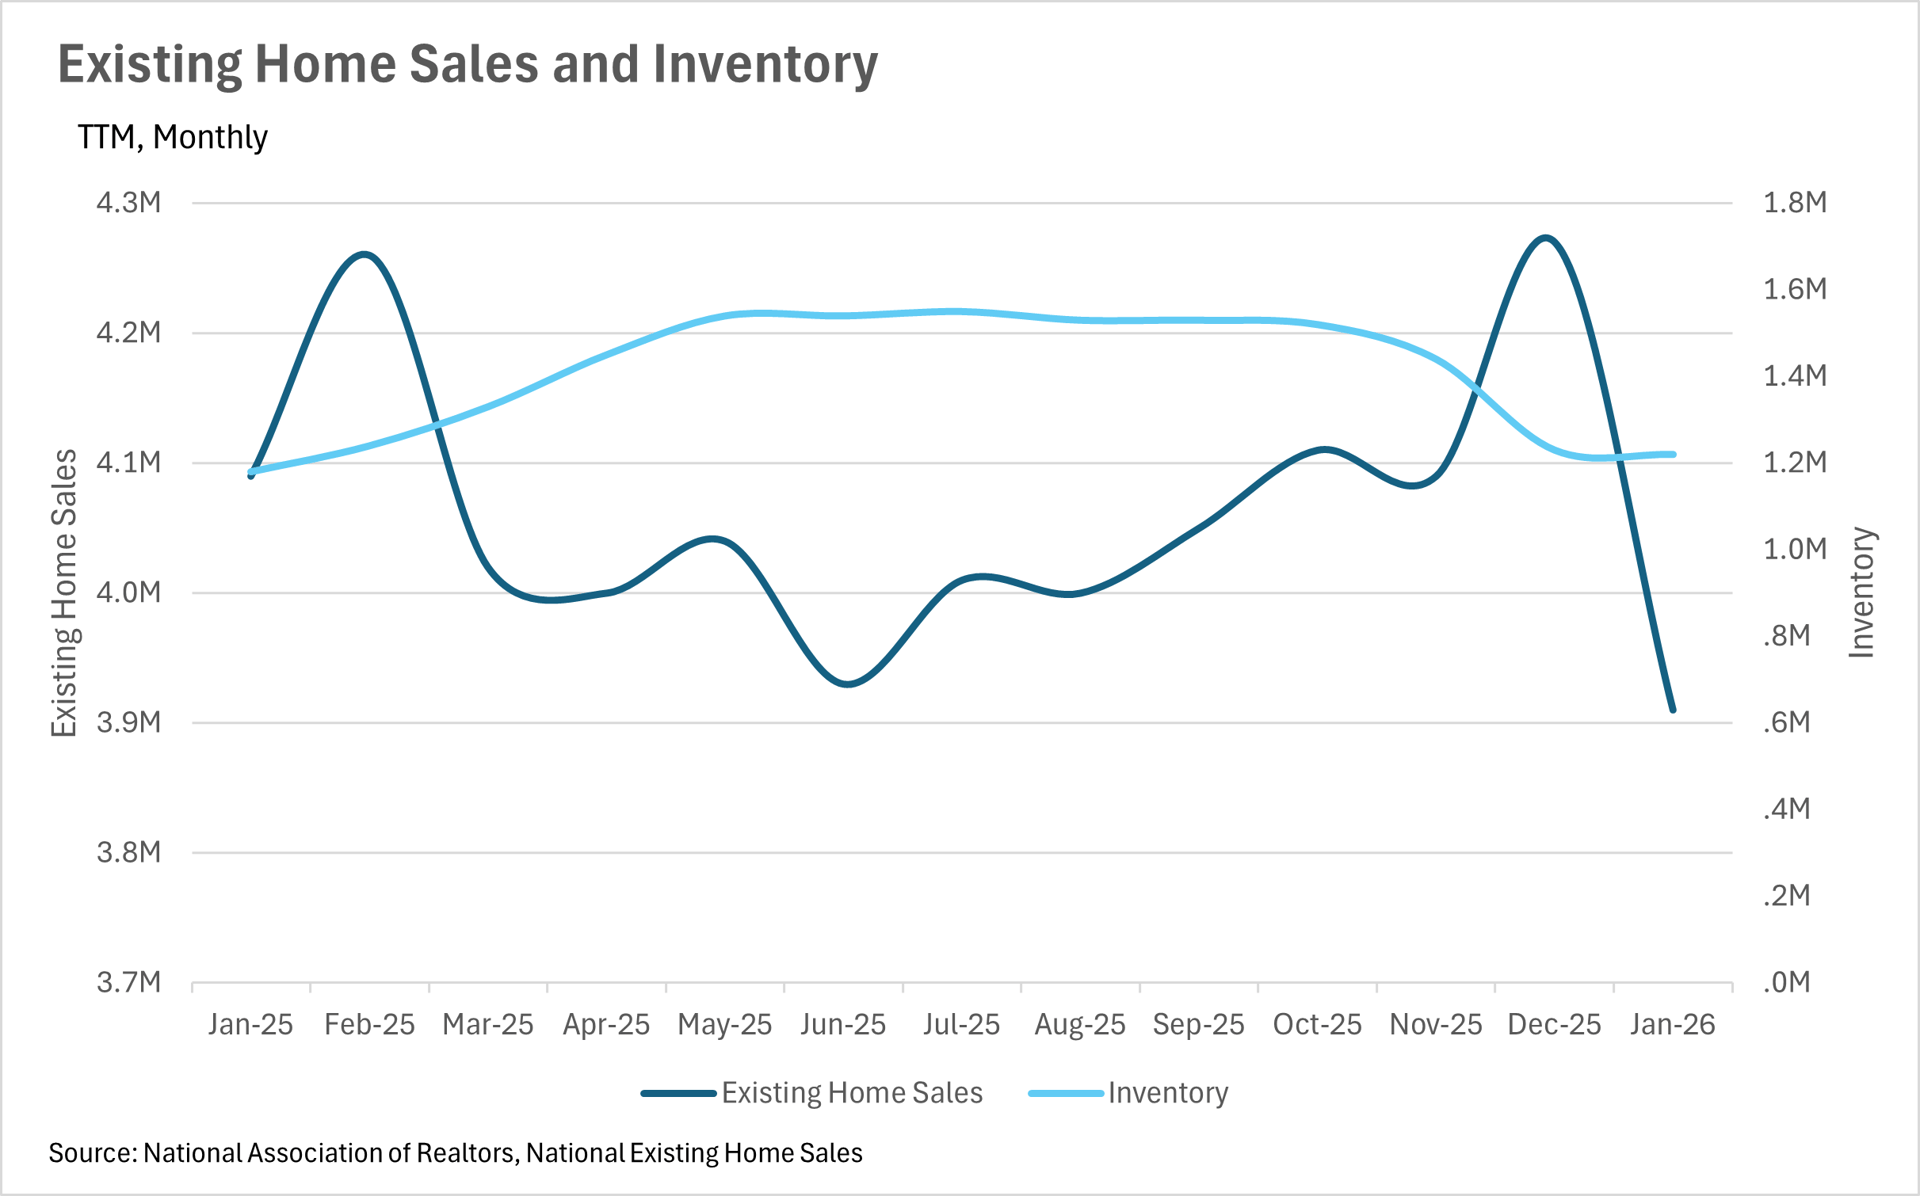
As we move out of the seasonally slow winter months, we're starting to see new listings pick up, which is a great sign for the market heading into the spring. In February, there were 362,180 new listings that hit the market, representing a 2.41% year-over-year increase and a 10.01% month-over-month increase. This uptick in new listings is encouraging, as it suggests that homeowners are starting to feel more comfortable putting their homes on the market. On the inventory side, there were 1,220,000 homes available for sale in January, which is up 3.39% on a year-over-year basis. While this is certainly a step in the right direction, it's worth noting that inventory levels are still well below the levels we need to see in order for the market to truly become balanced. That said, the combination of rising new listings and modestly higher inventory levels should give buyers a few more options to choose from as we head into the busier spring months.
Buyers are still taking their time on the sidelines.
Despite the fact that mortgage rates have come down by nearly 11% on a year-over-year basis, buyers are still being cautious. In January, existing home sales came in at 3,910,000, representing a 4.40% decline on a year-over-year basis and an 8.43% decline from December. This tells us that while the affordability picture has improved quite a bit, many buyers are still waiting for rates to come down even further before they make their move. It's also worth considering that the seasonal slowdown plays a role here, as January is historically one of the slower months for home sales. As we move into the spring and summer, it'll be worth keeping a close eye on this metric to see if the lower rates and increasing inventory levels are enough to bring buyers off the sidelines.
A market that could go either way in the coming months
Right now, the national market is in an interesting position. Inventory levels are slightly higher than they were last year, but existing home sales have declined, which means that the supply of homes on the market is lasting a bit longer than it was at this time last year. With new listings beginning to pick up heading into the spring, and buyers still largely sitting on the sidelines, we could see inventory continue to build in the coming months. However, if mortgage rates continue to trend downward, that could be the catalyst that brings buyers back into the market in a big way. As always, real estate is a highly localized asset, which is why you should check out what's going on in your local market below in the Local Lowdown!
Big Story Data
The Local Lowdown
Quick Take:
-
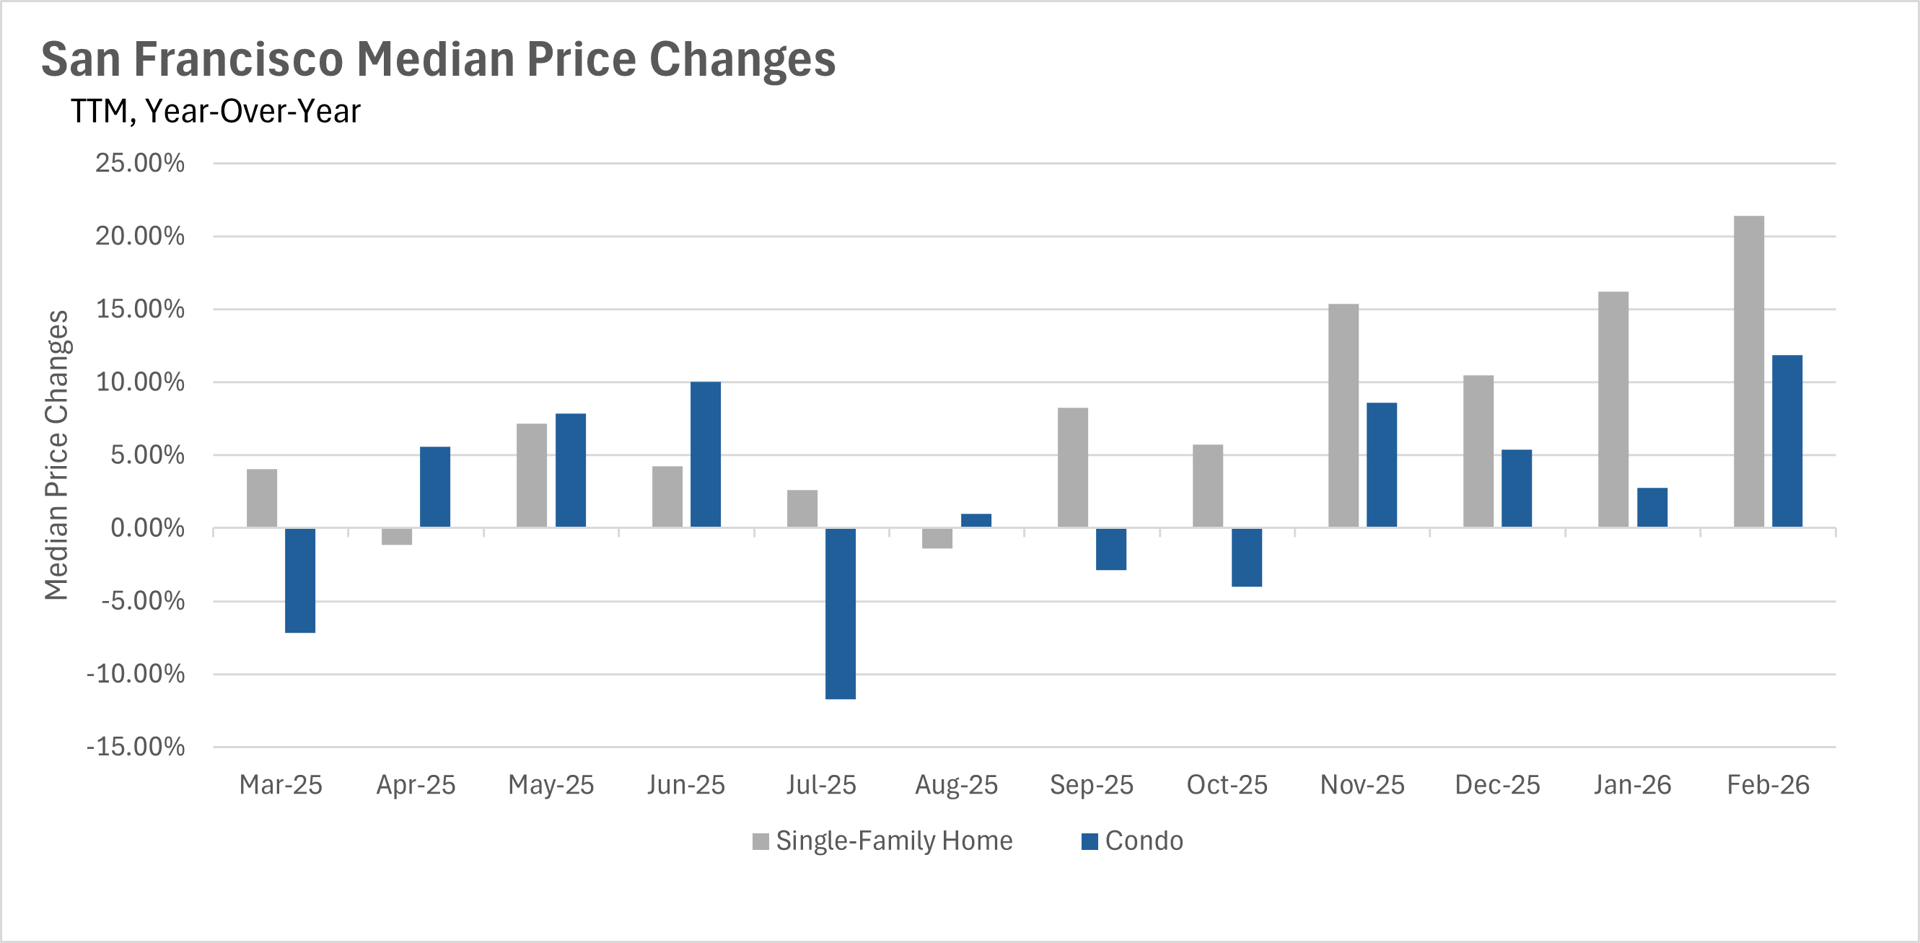
Median sale prices surged across the board in February, with single-family homes up more than 21% year-over-year.
-
Inventory remains severely constrained, with both single-family homes and condos down nearly 40% compared to last year.
-
Listings are flying off the market at an incredible pace, with single-family homes selling in just 12 days and condos in just 14 days.
Note: You can find the charts/graphs for the Local Lowdown at the end of this section.
San Francisco's housing market is on fire to start 2026
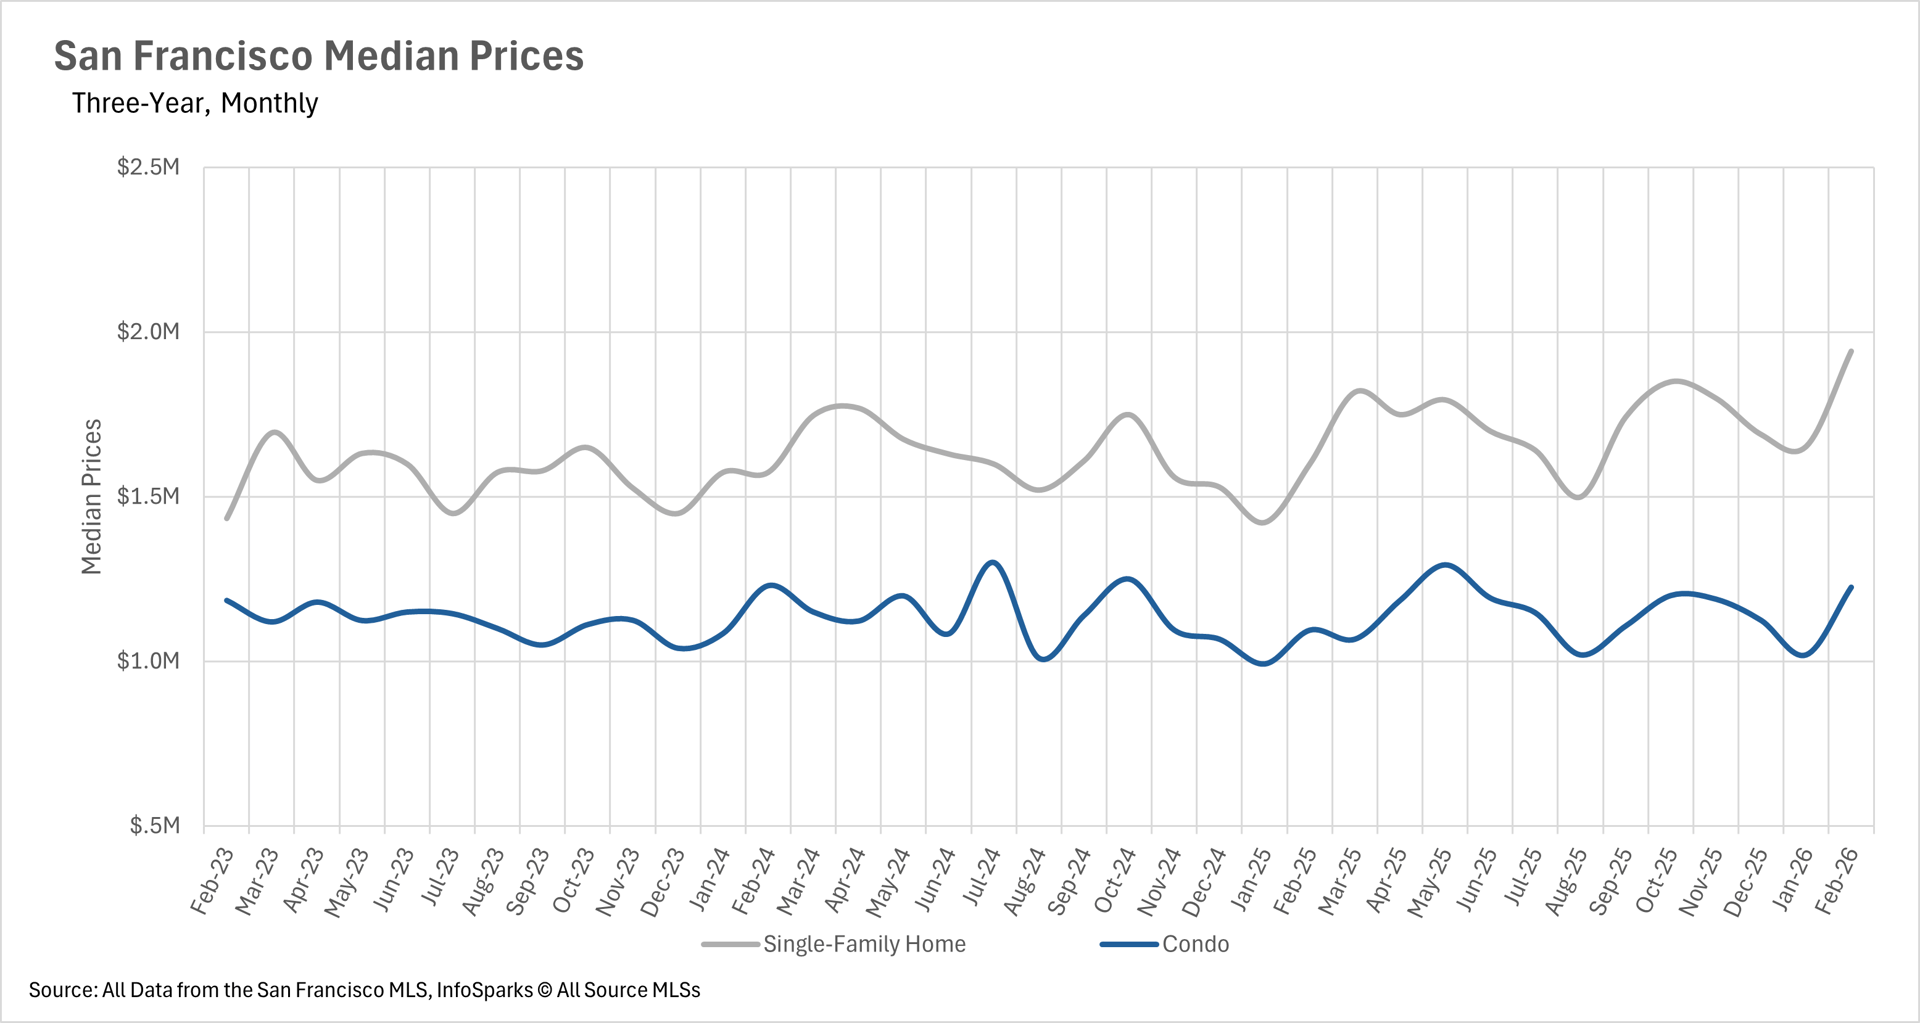
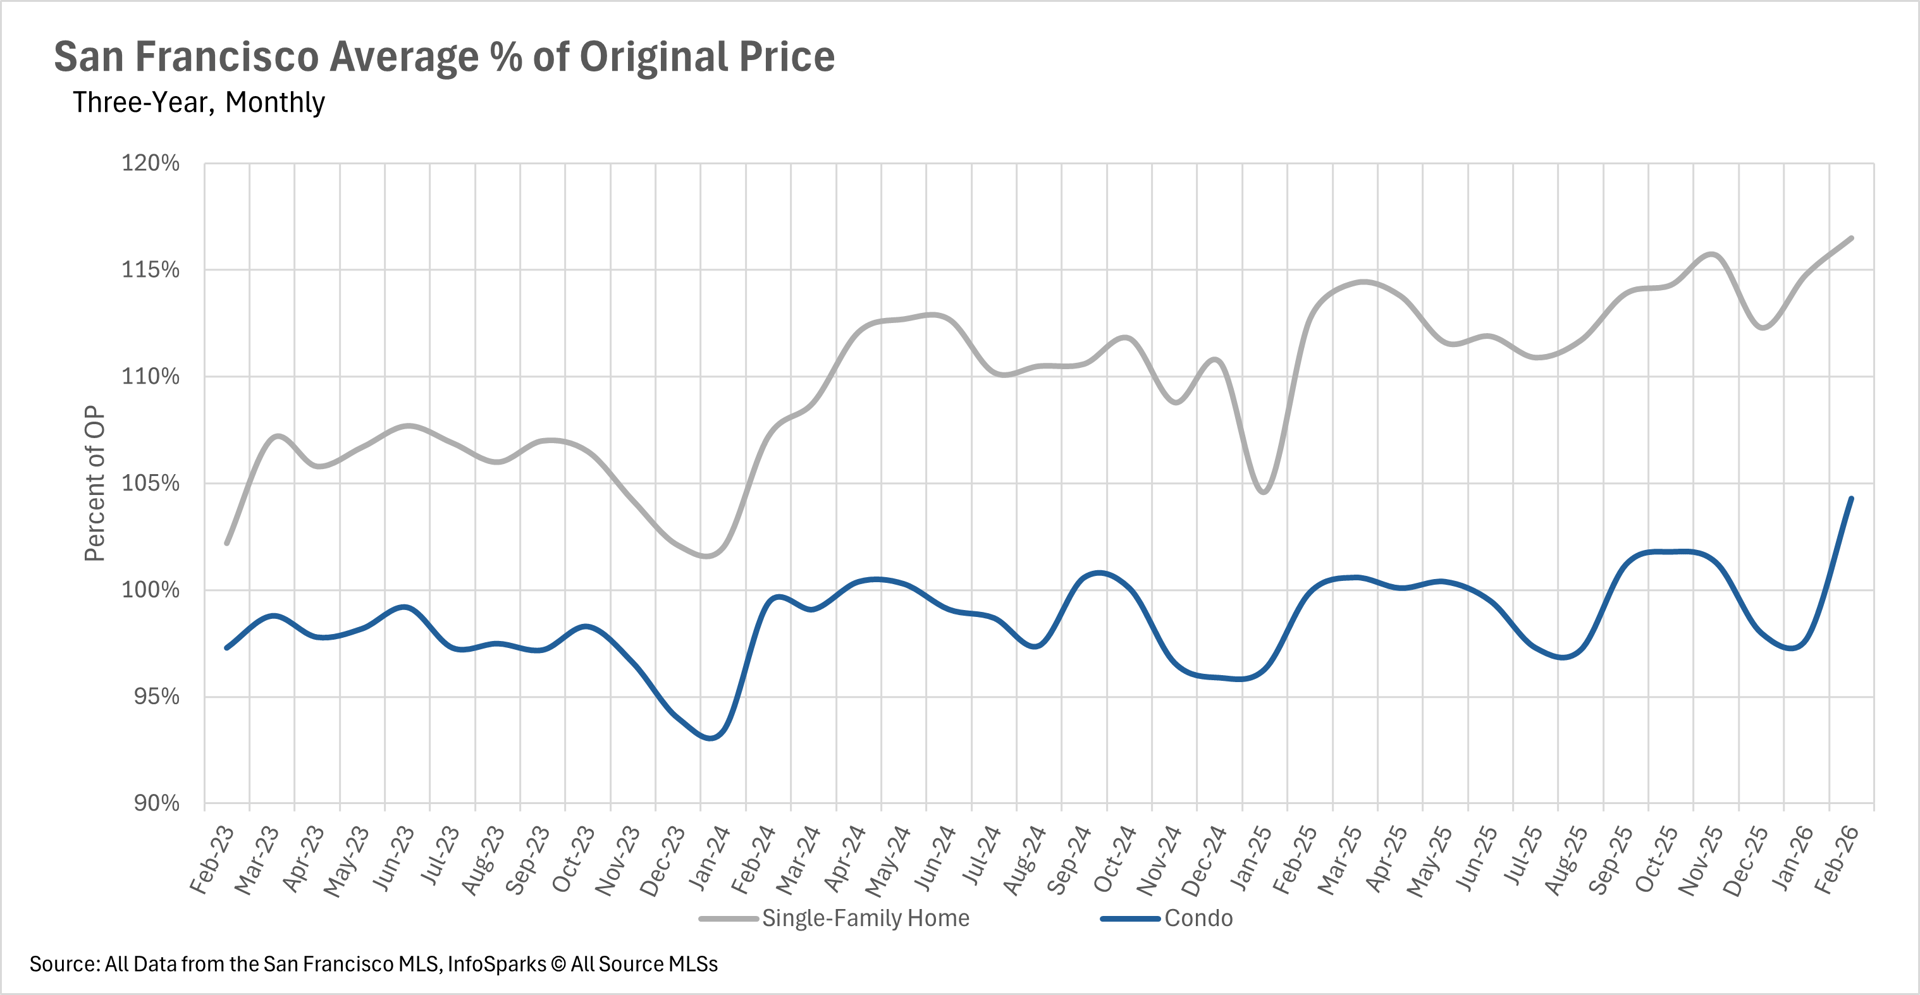
February brought extraordinary price appreciation to San Francisco, with both single-family homes and condos posting impressive year-over-year gains. Single-family homes saw a remarkable 21.41% increase in median sale price, with the median home selling for $1,942,500. Condos also had an exceptional month, with the median sale price climbing 11.87% to $1,225,000. The competition for homes has reached a fever pitch, with single-family homes selling for 16.5% over the original asking price on average, and condos selling for 4.3% over asking. This marks one of the strongest months for condo premiums in recent memory.
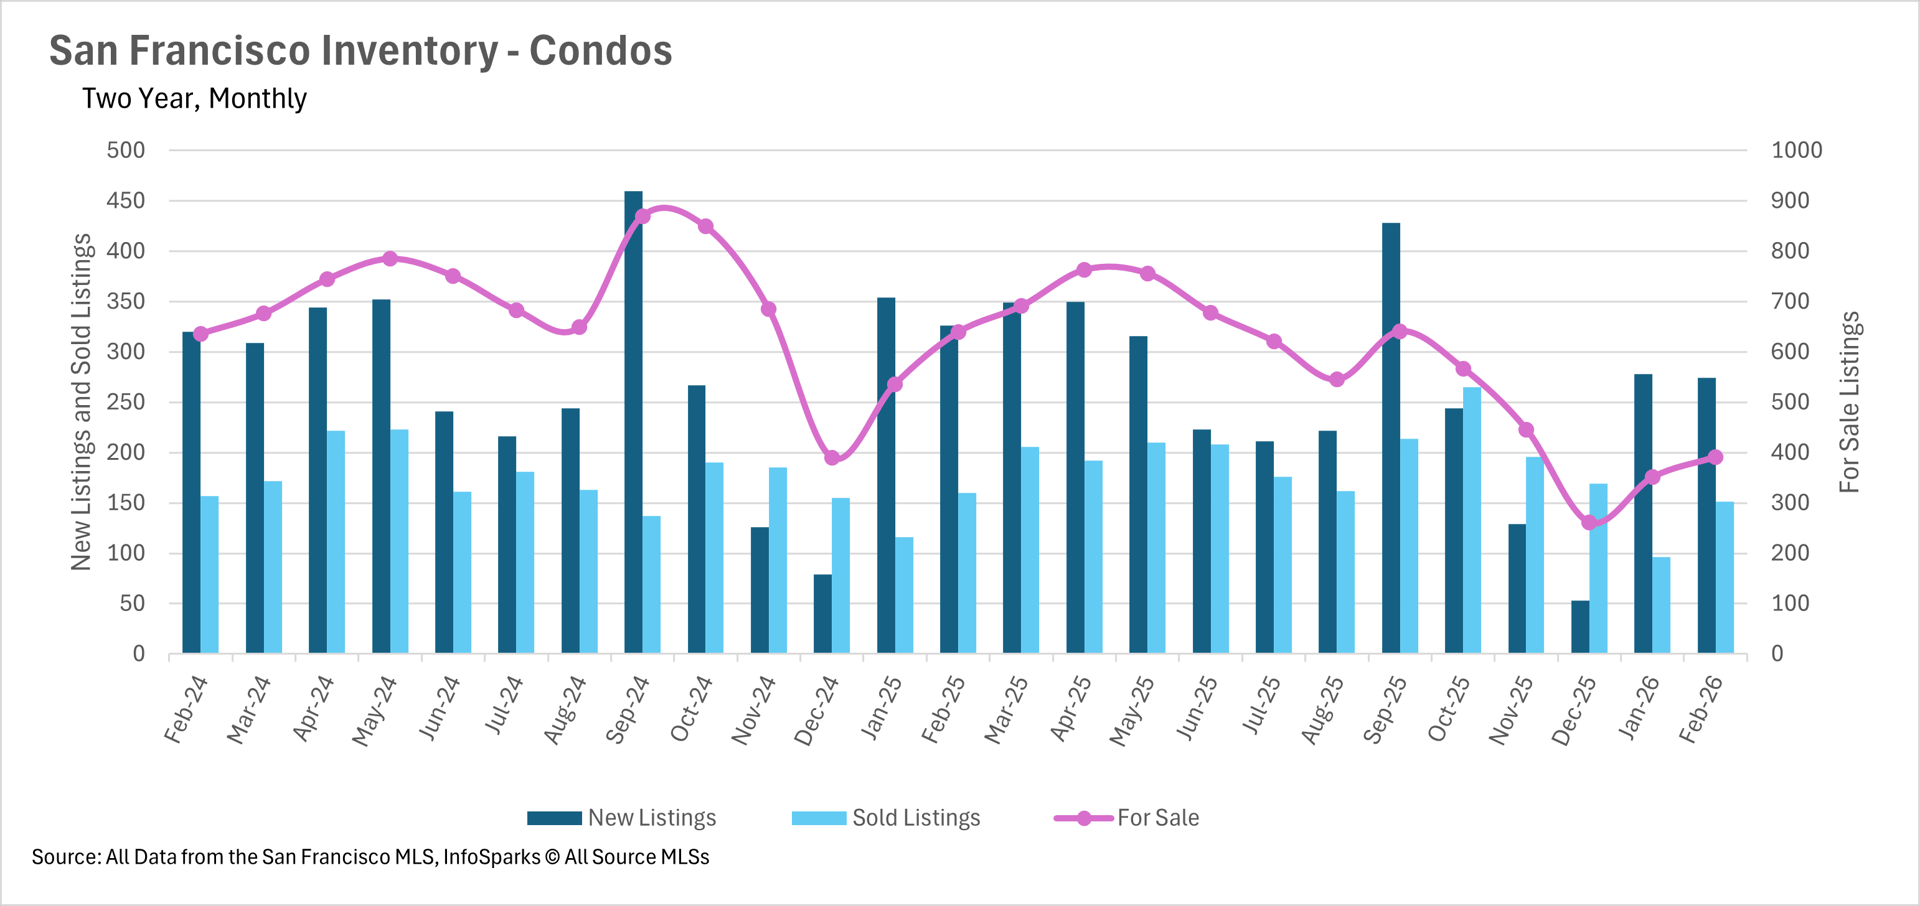
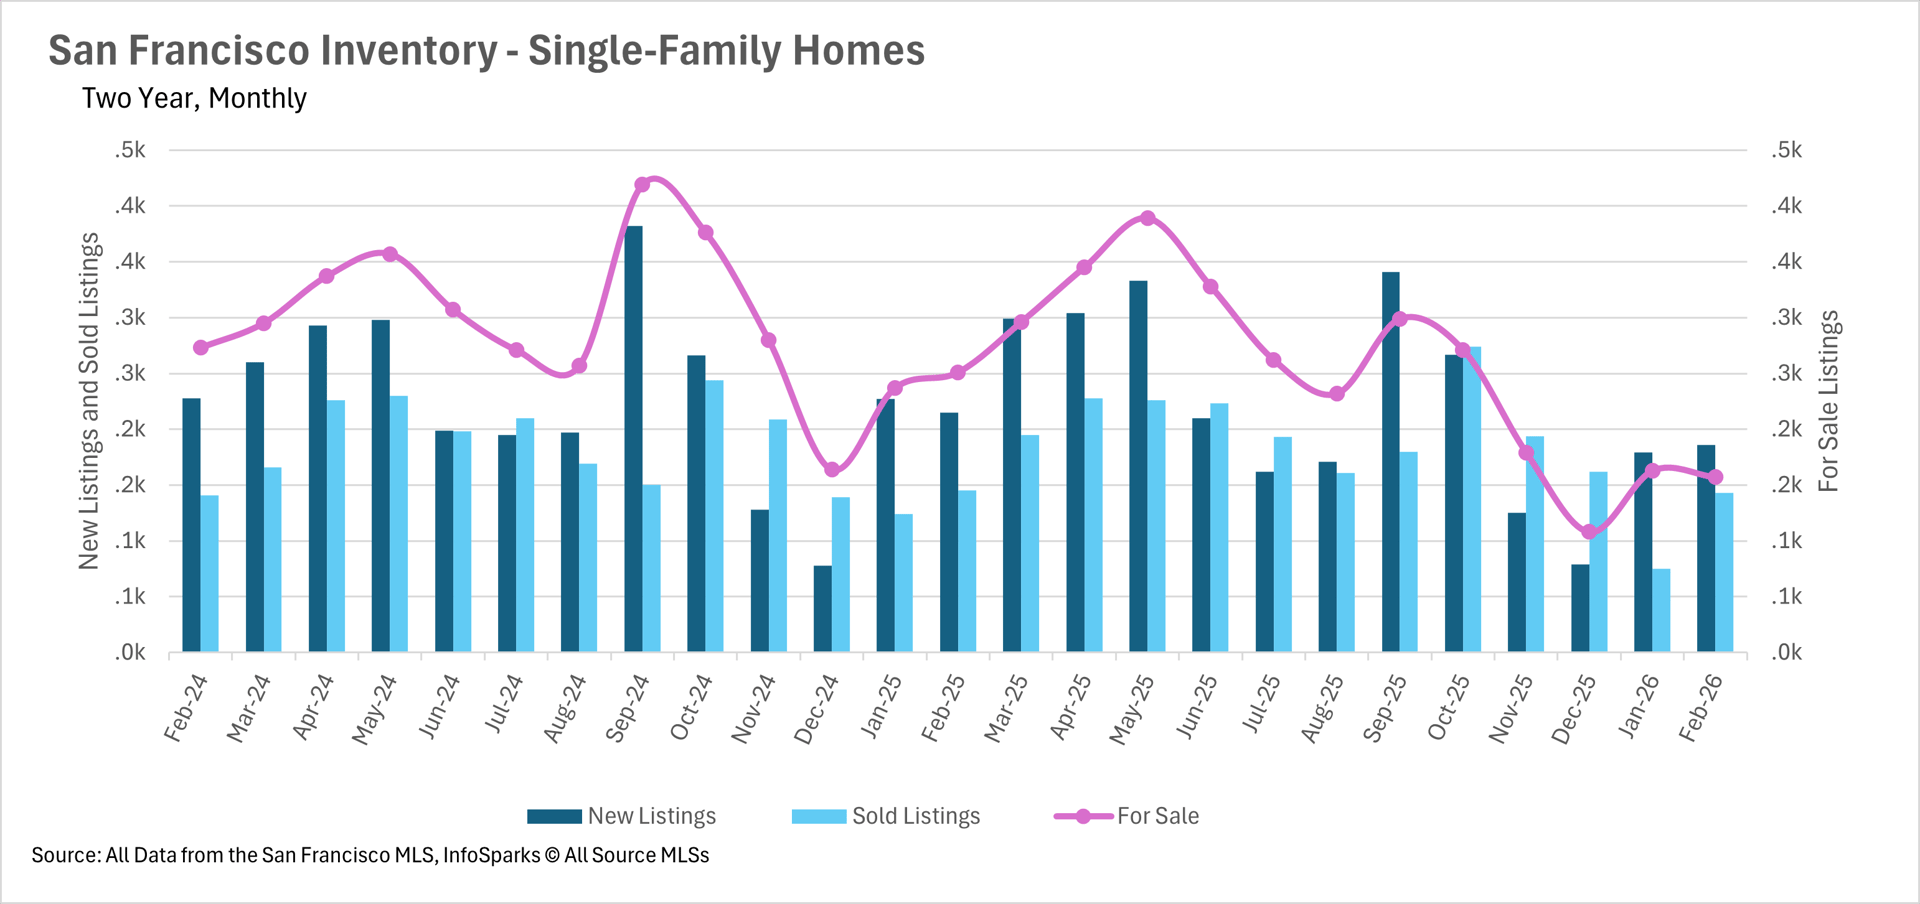
Inventory levels remain at historic lows throughout San Francisco
Despite the typical spring uptick in new listings, inventory levels remain drastically below where they were a year ago. There are currently just 157 single-family homes for sale in San Francisco, representing a 37.45% decline compared to February 2025. The condo market is experiencing a similar shortage, with inventory down 38.81% year-over-year to just 391 units. Combined, there are fewer than 550 homes available for sale in the entire city. Until more homeowners decide to list their properties, this severe supply crunch will continue to fuel intense competition among buyers.
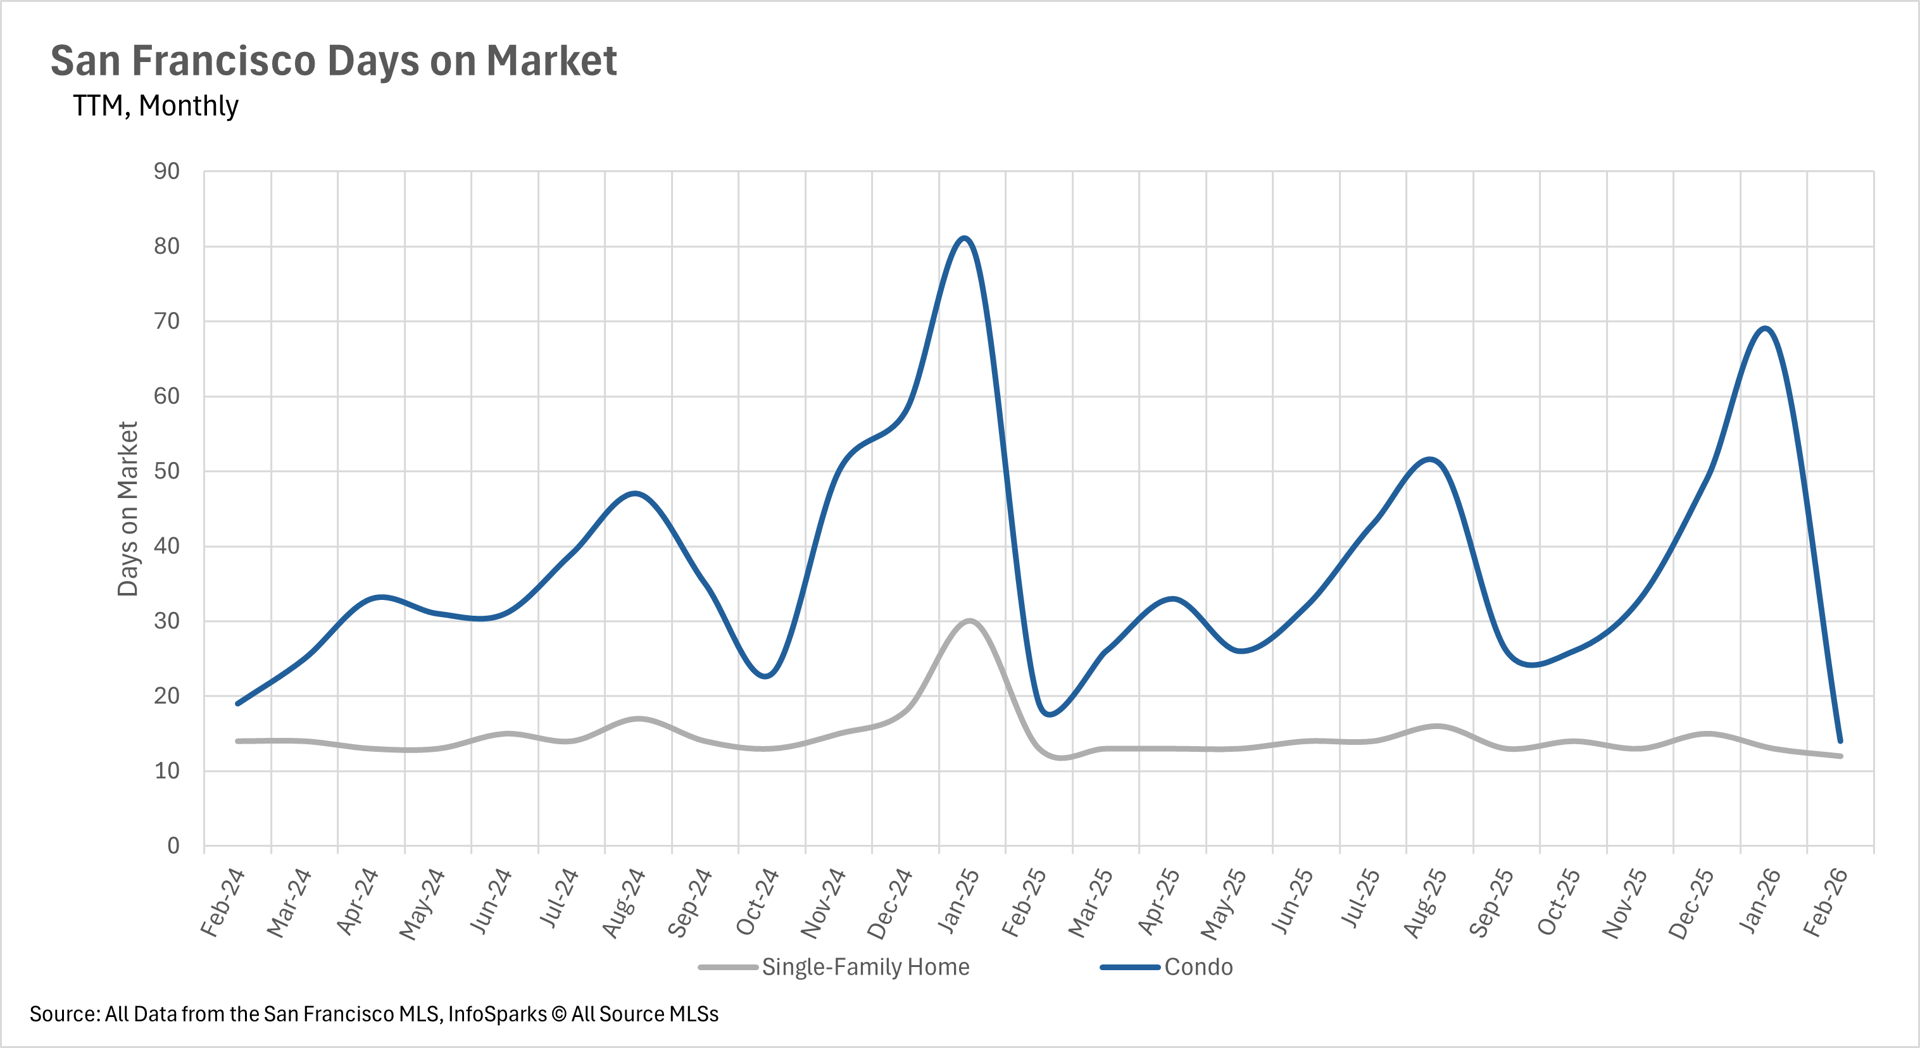
Homes are selling at a blistering pace at San Francisco
With inventory at such critically low levels, listings are being snapped up almost as soon as they hit the market. The average single-family home is selling in just 12 days, representing a 7.69% decrease compared to last February. The condo market has seen an even more dramatic acceleration, with the average condo selling in just 14 days, a 26.32% year-over-year decline. This rapid pace means buyers must be prepared to act immediately when a desirable property becomes available, leaving little room for deliberation in this ultra-competitive market.
San Francisco is one of the strongest seller's markets in California
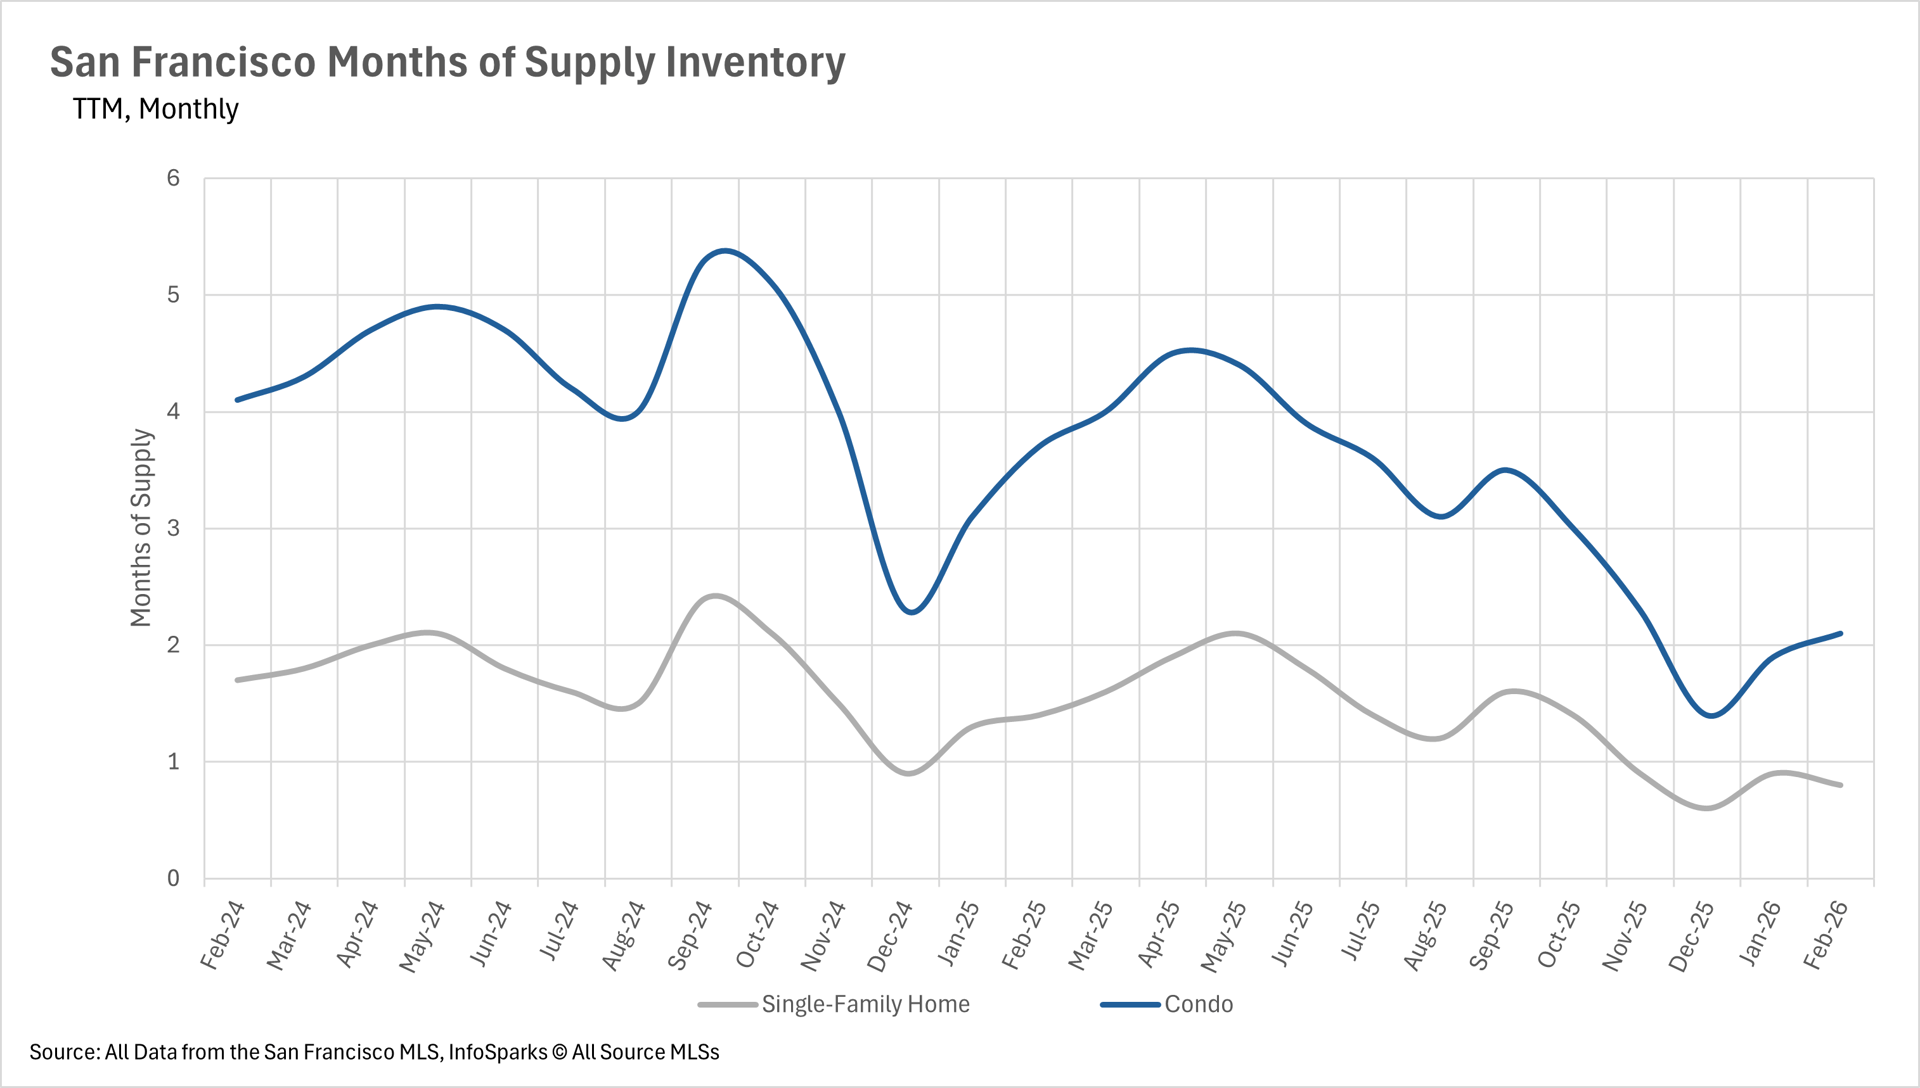
When determining whether a market is a buyers' market or a sellers' market, we look to the Months of Supply Inventory (MSI) metric. The state of California has historically averaged around three months of MSI, so any area with at or around three months of MSI is considered a balanced market. Any market that has lower than three months of MSI is considered a seller's market, whereas markets with more than three months of MSI are considered buyers' markets.
With just 0.8 months of single-family home inventory and 2.1 months of condo inventory on the market, San Francisco remains a deeply entrenched seller's market across all property types. Both figures represent year-over-year declines of more than 40%, underscoring just how tight conditions have become. Sellers continue to hold all the leverage in negotiations, and there is no indication that this dynamic will shift any time soon.
Local Lowdown Data