The Big Story
Quick Take:
-
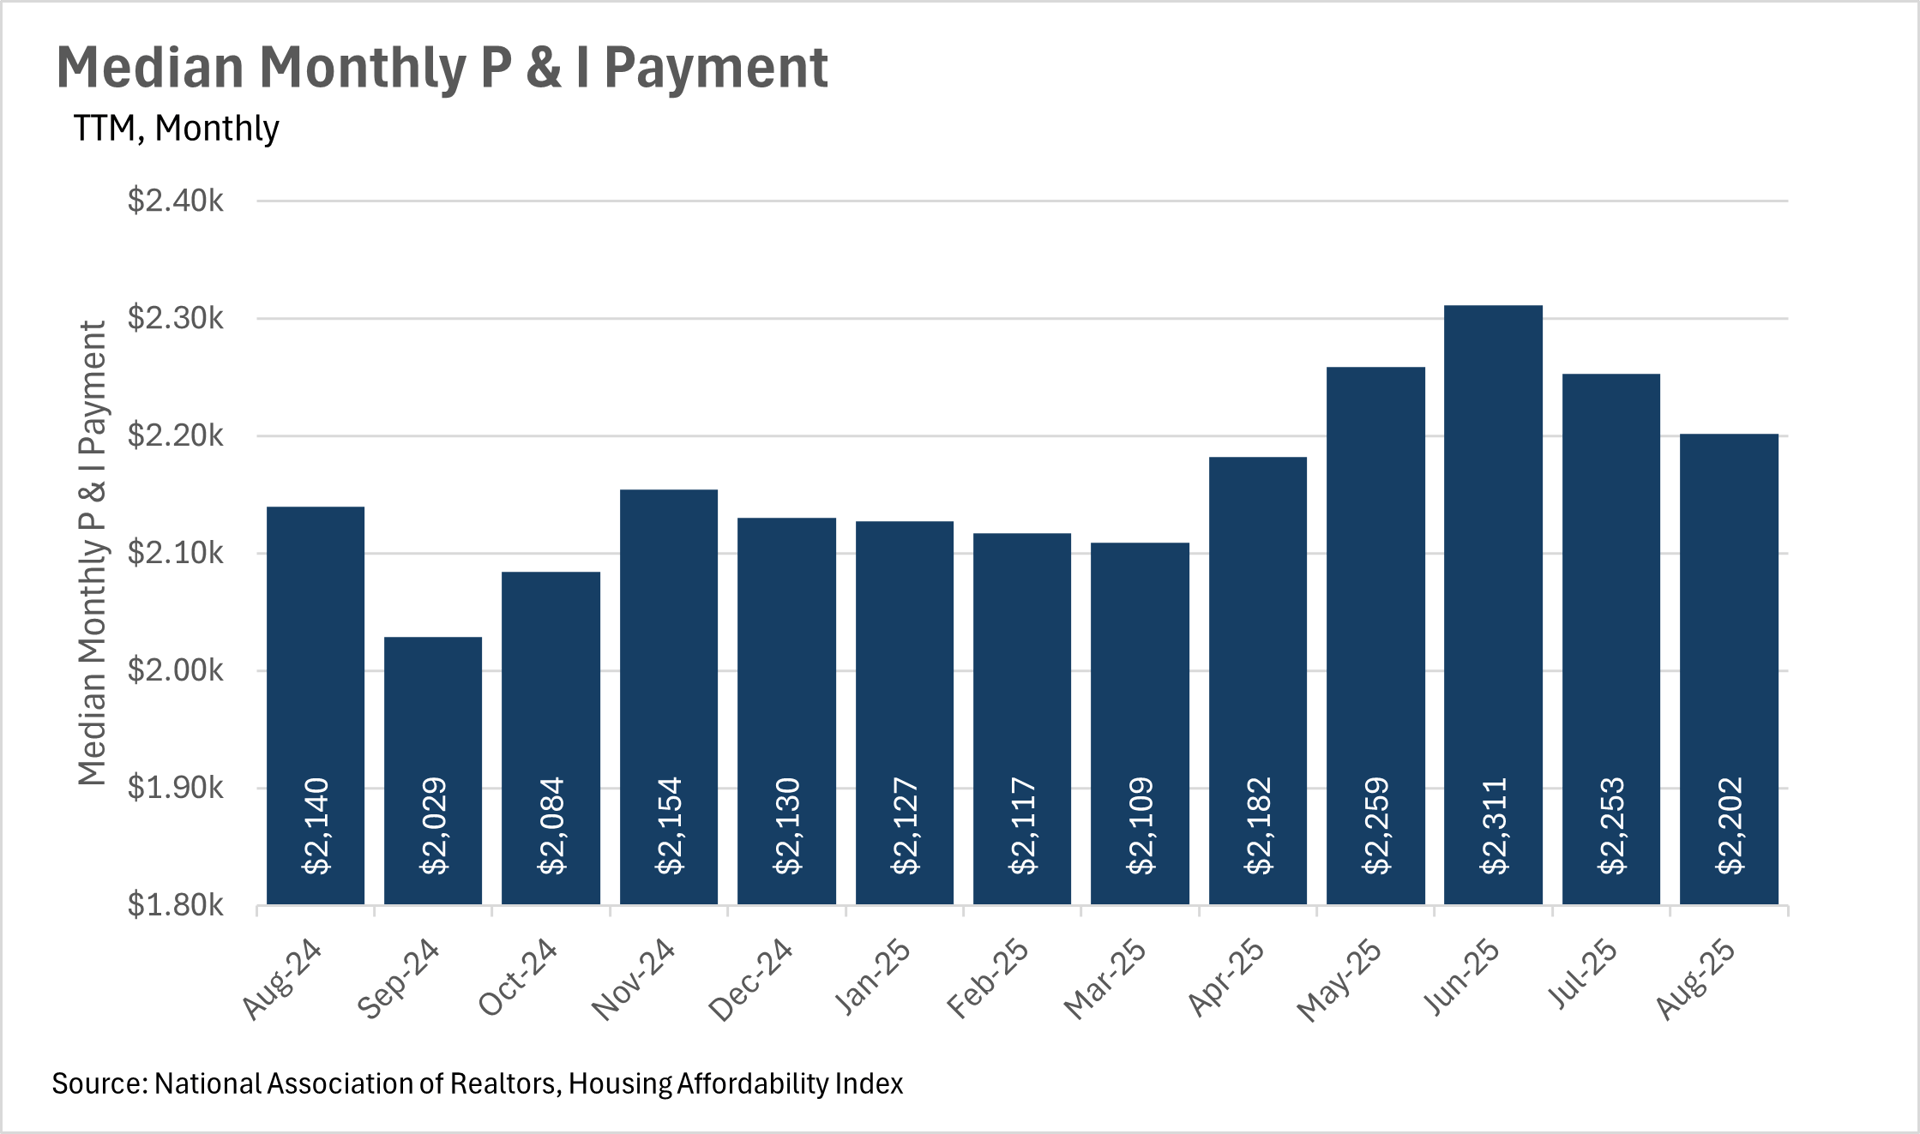
Affordability remains an issue nationwide, as monthly P&I payments ticked up by 2.90% year-over-year.
-
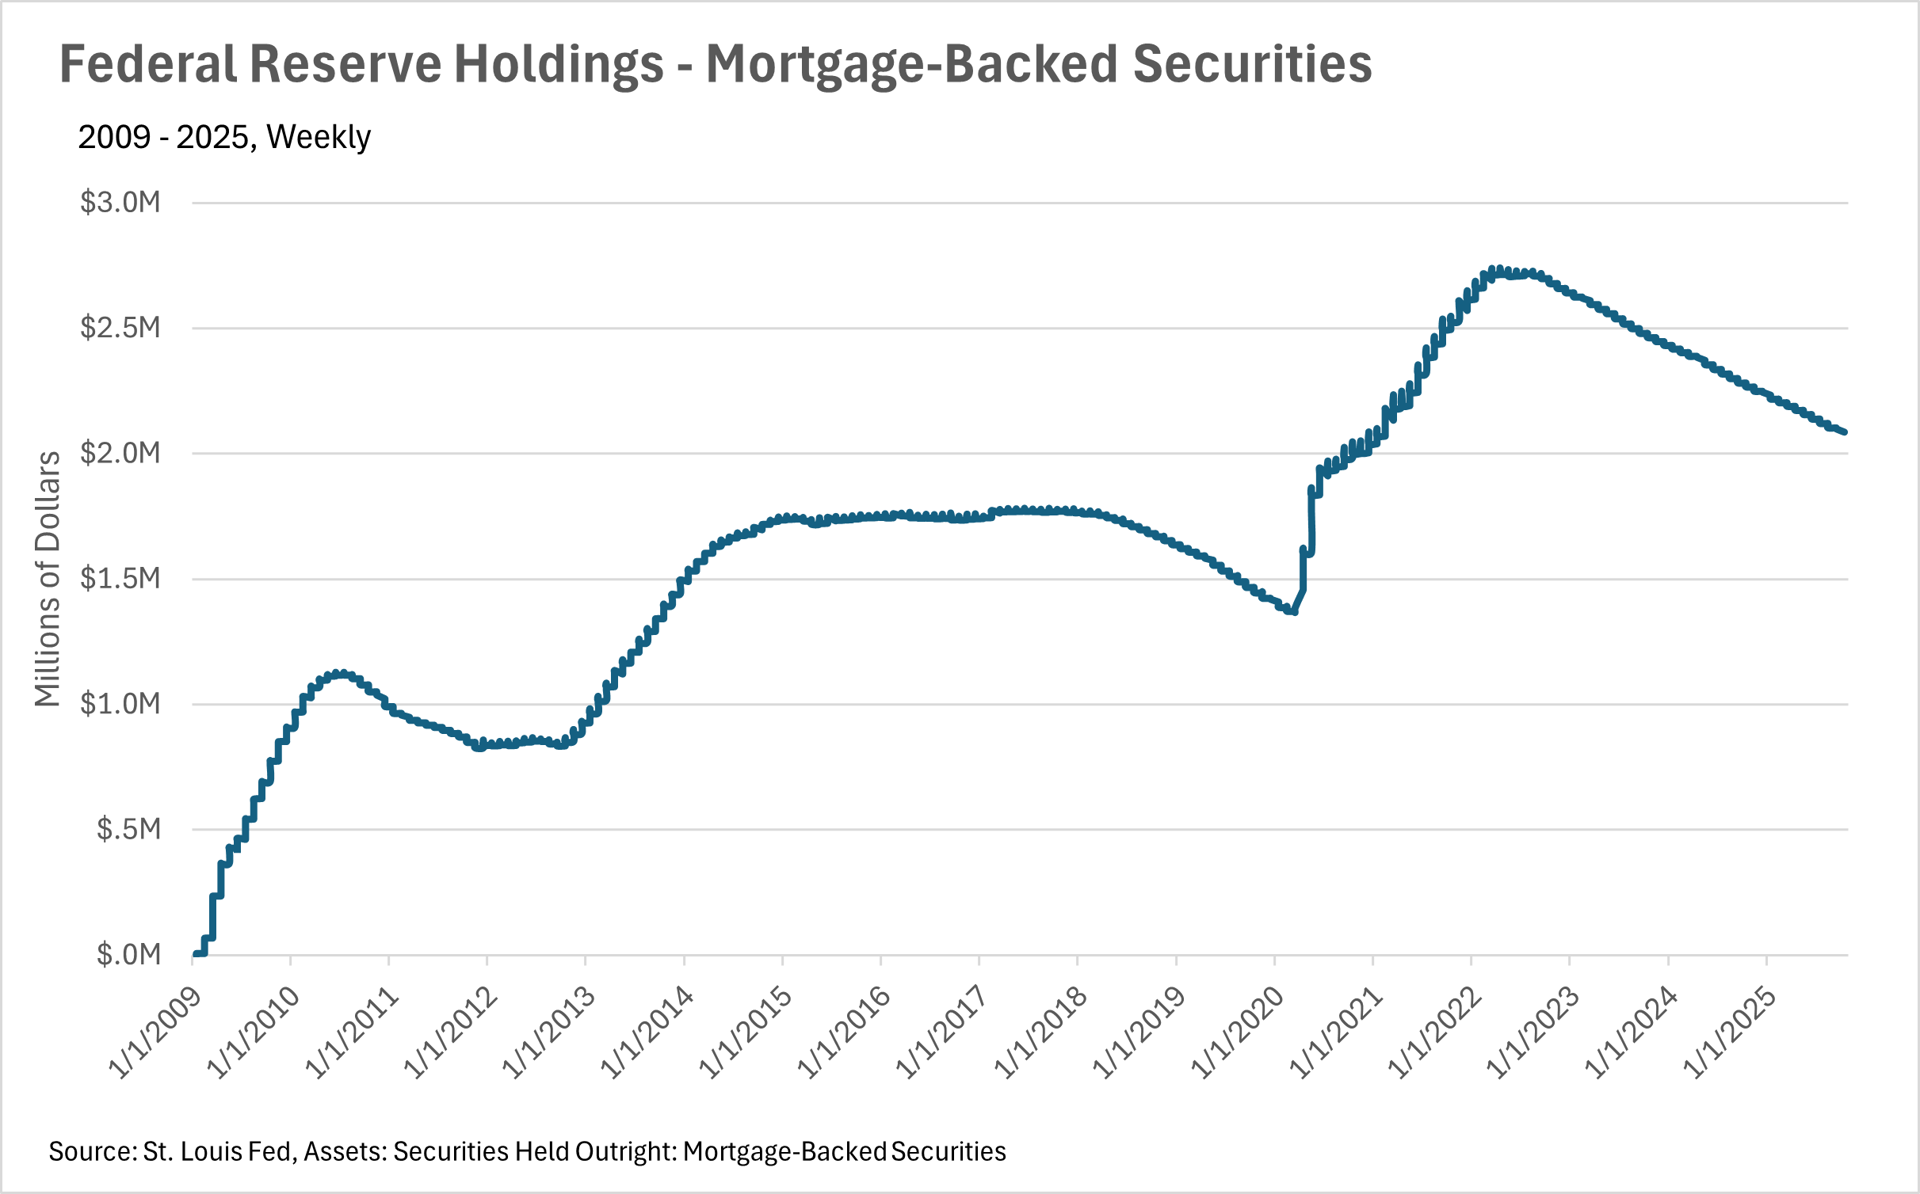
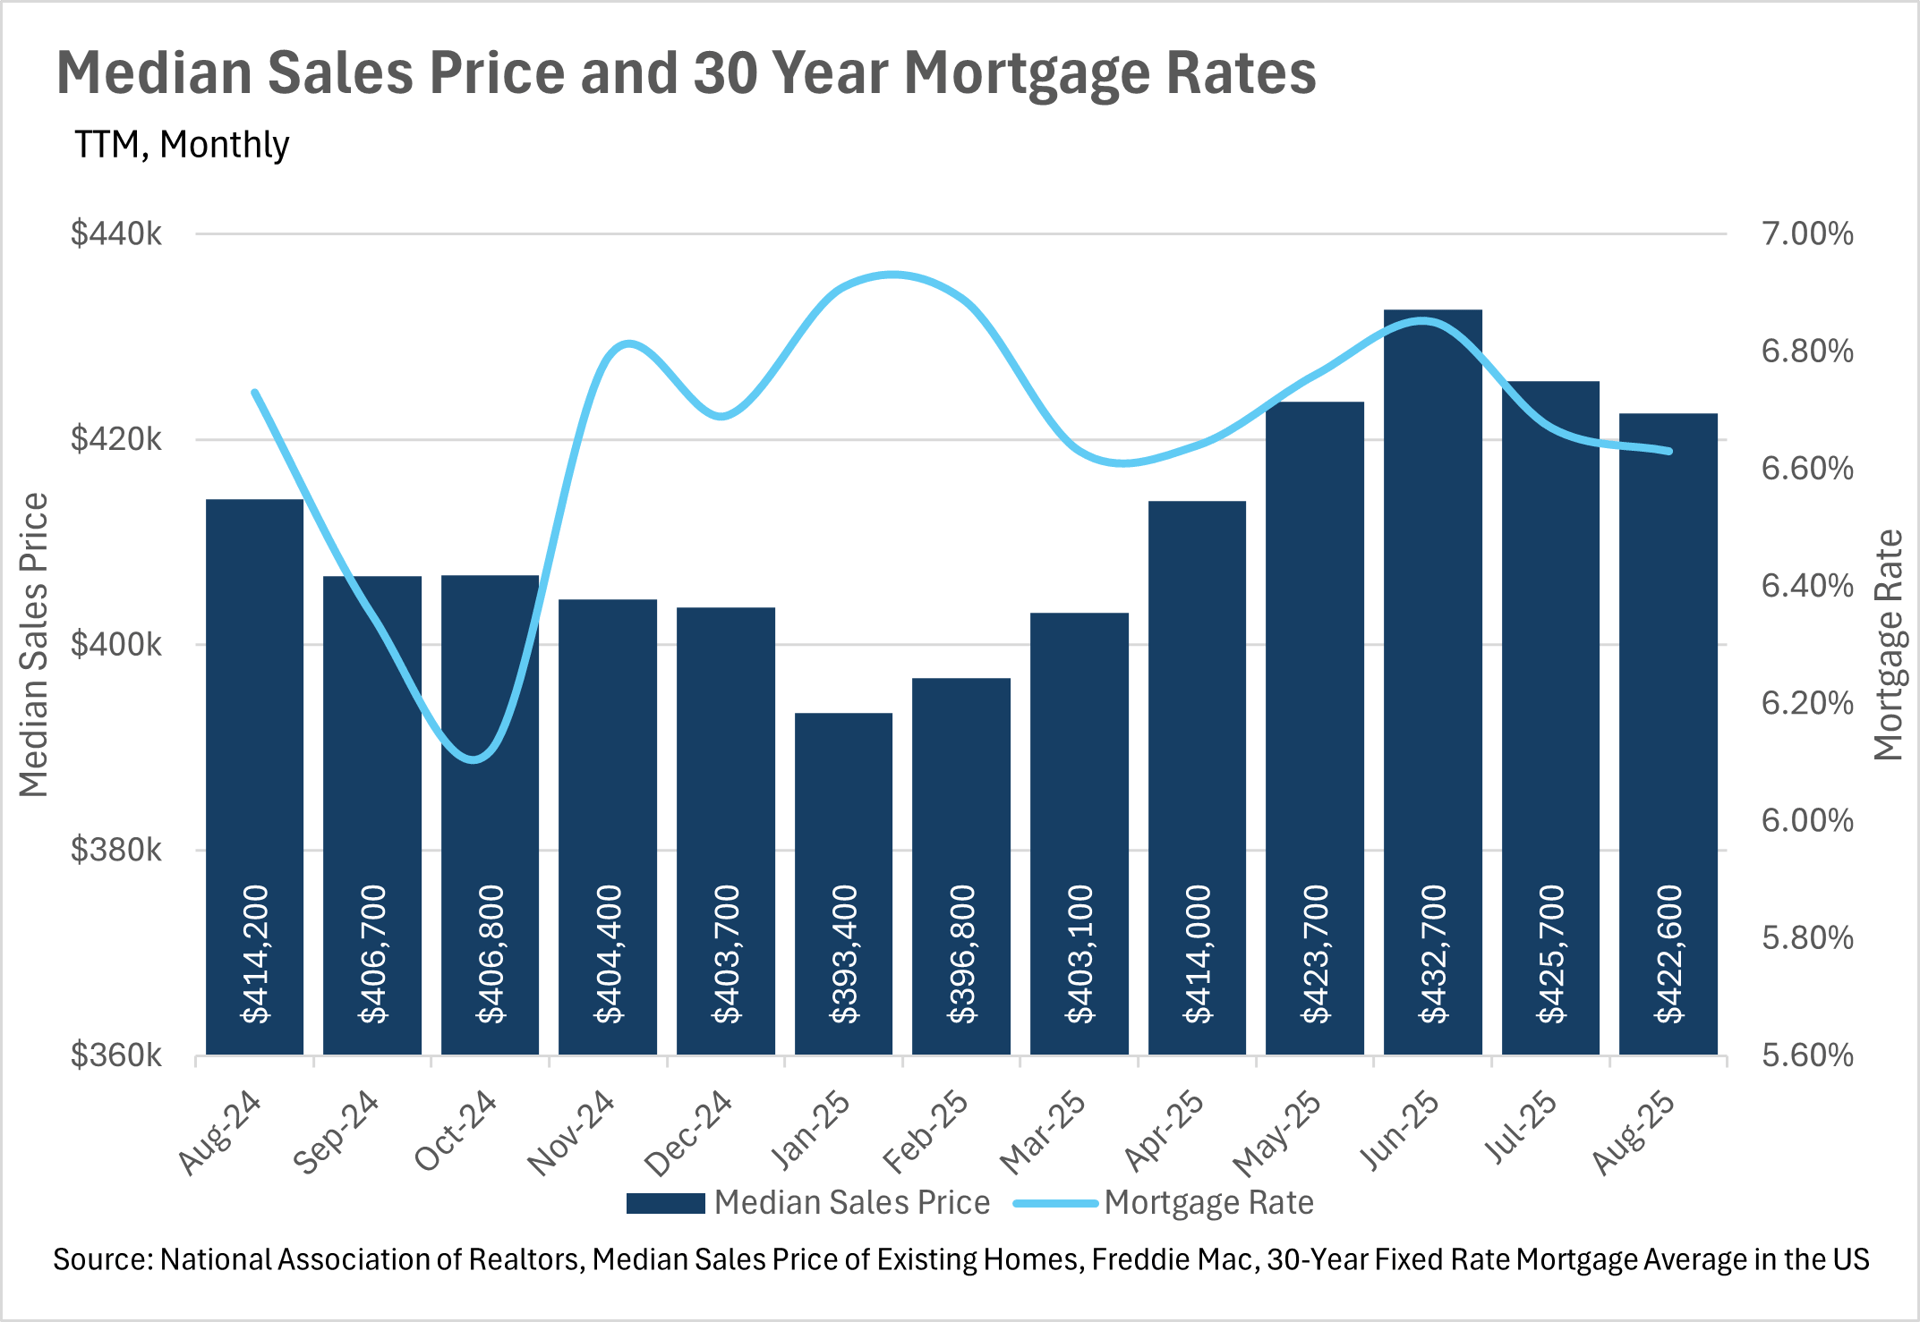
Mortgage rates are finally starting to decline, as we enter a rate-cutting cycle.
-
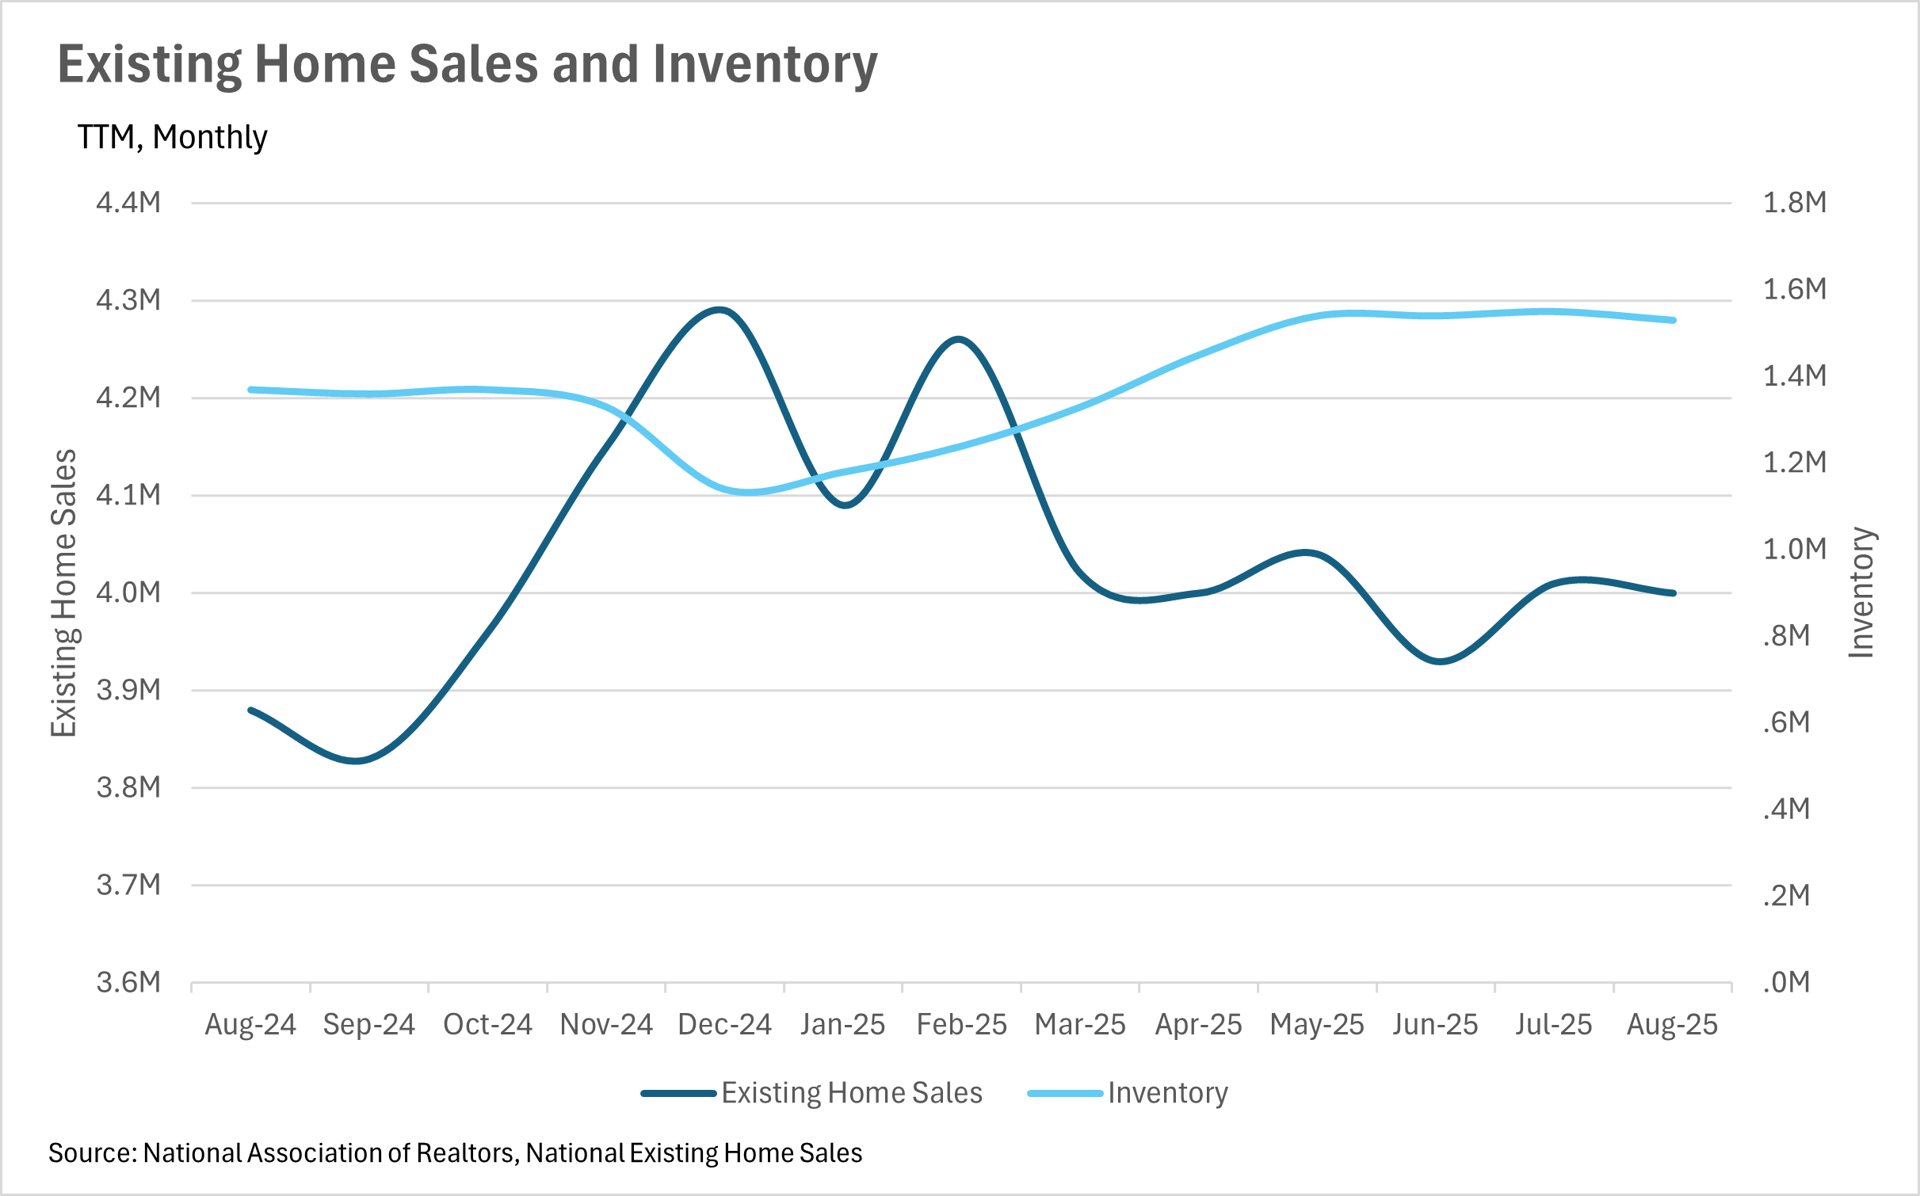
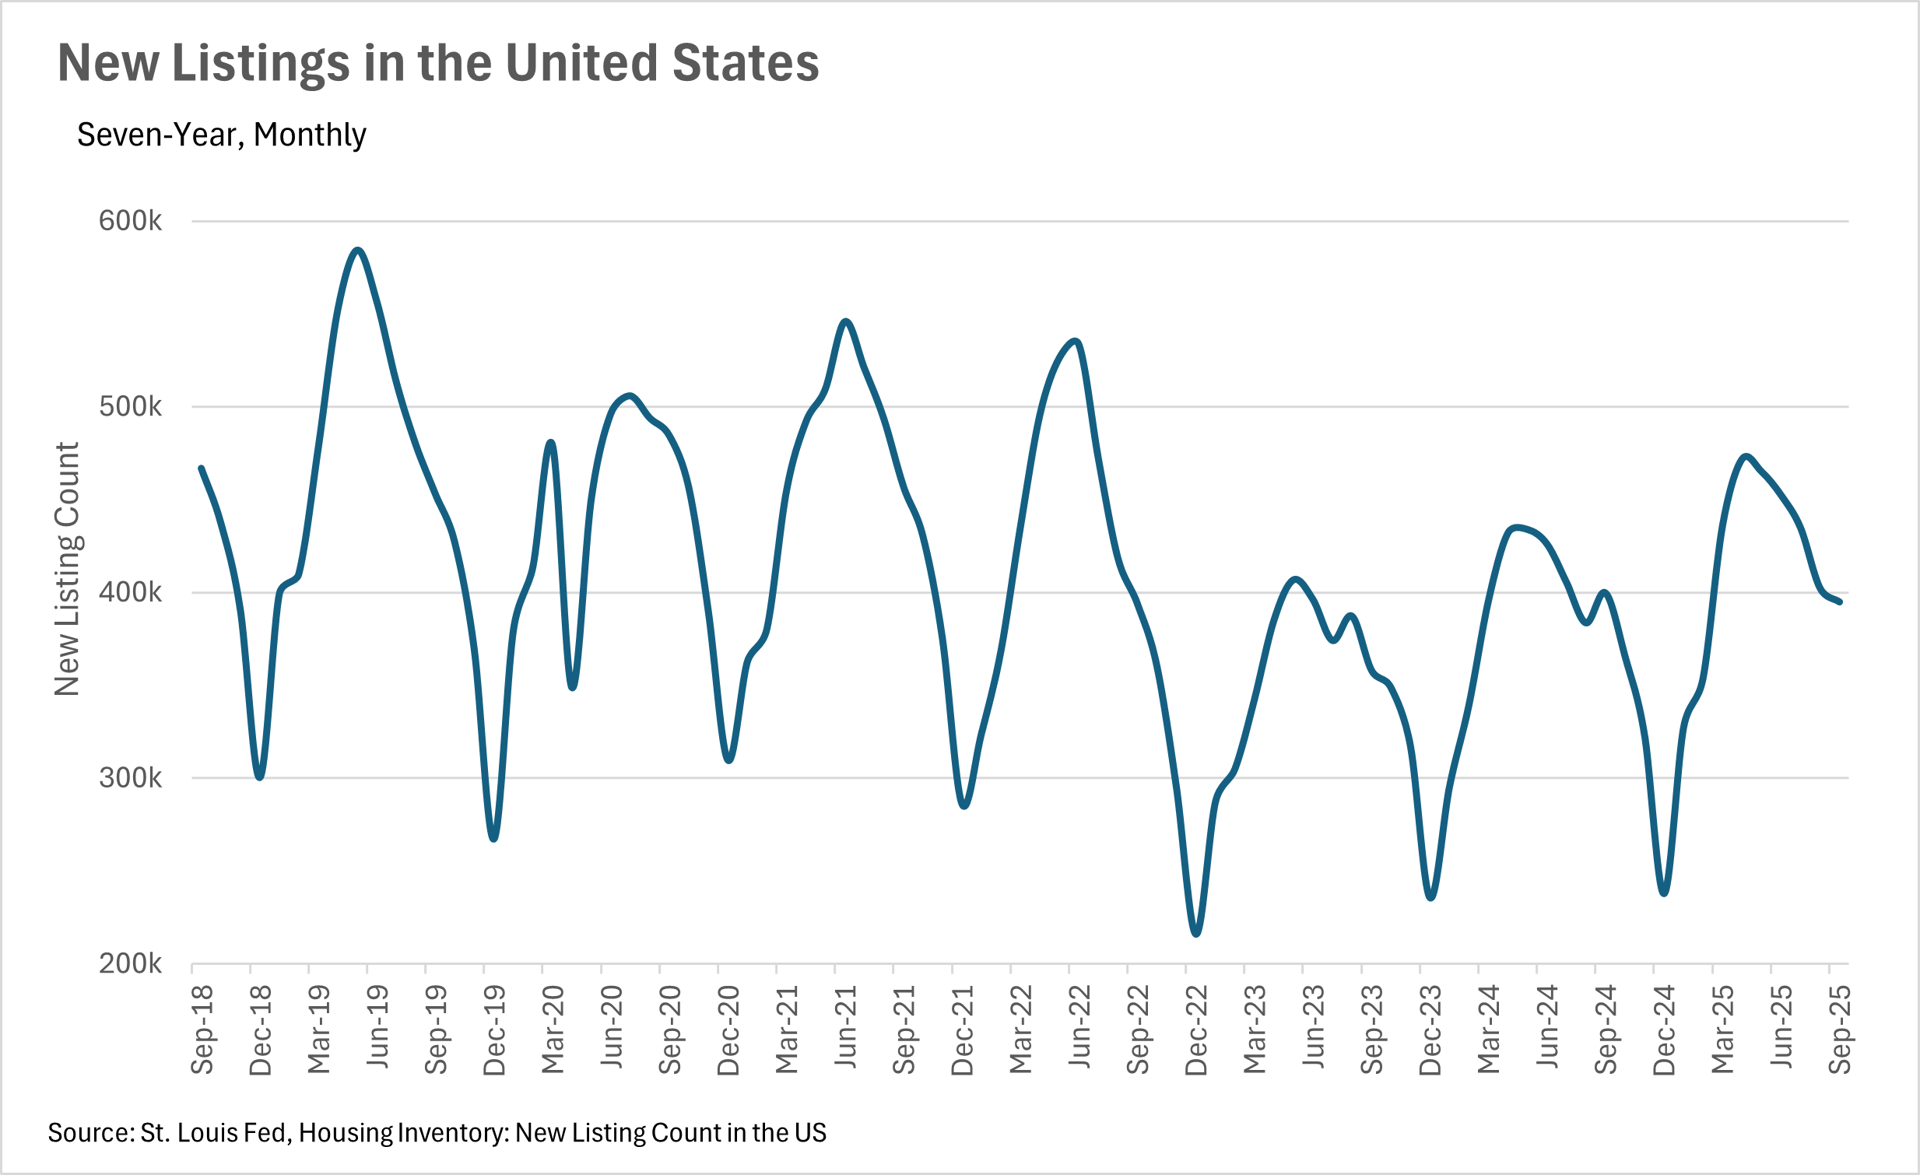
Inventories are still growing at a faster rate than existing home sales.
-
Quick observation about Macroeconomics/The Broader Market
Note: You can find the charts & graphs for the Big Story at the end of the following section.
*National Association of REALTORS® data is released two months behind, so we estimate the most recent month’s data when possible and appropriate.
Mortgage rates have begun to decline, thanks to the Feds
Recently, the Fed came out and announced a quarter-point cut to the federal funds rate, but that was not the most exciting news that they announced. Fed Chairman Jerome Powell announced that we should expect two more quarter-point cuts before the end of the year, signalling that we are in the beginning innings of a Fed cutting cycle. This, of course, is huge news for the housing market. Despite the fact that many markets have retained much of their post-pandemic gains in value, the housing market has been largely stagnant, with inventories building as home buyers decide to sit on the sidelines and wait.
Affordability remains a concern throughout the country
Housing affordability has been a huge problem facing the country ever since the onset of the COVID-19 pandemic. Although many thought that home prices would decrease as interest rates increased, many markets did not see a normalization of home prices. This, of course, has left many prospective home buyers worried about where the market will go as we enter a new rate-cutting cycle. Many fear that lower interest rates may bring a slew of new buyers to the market, pushing home prices up even further, and making home ownership even less attainable for first-time buyers. On the flip side, homeowners stand to benefit in a huge way if declining interest rates lead to a housing frenzy, as they’ll accumulate significant equity in a very small period of time, just like what we saw throughout 2020-2022.
Inventories continue to build nationwide
As we mentioned above, the national inventory is quite a bit higher than last year, with 11.68% more homes listed on the market. This really underscores the fact that buyers have decided mainly to throw in the towel and wait for a better chance to purchase a home. When you combine this with the fact that there were 4.88% more new homes hitting the market than this time last year, you have a recipe for growing inventory!
Current market dynamics created an interesting setup for 2026
As we move into the seasonally slow months, the market environment that we’re in is setting up for what could be a very interesting 2026. Inventories are still growing (for now), and interest rates are falling, which could put us in a very interesting position when the spring frenzy begins next year. It’ll be important to keep a keen eye on both the market and broader macroeconomic conditions throughout the fall and winter, so that you and your clients are ready for whatever spring has to throw at you.
All of this is just what we’re seeing at a national level, though. To get a better idea of what’s going on in your local market, be sure to check out your local lowdown below:
Big Story Data
The Local Lowdown
Quick Take:
-
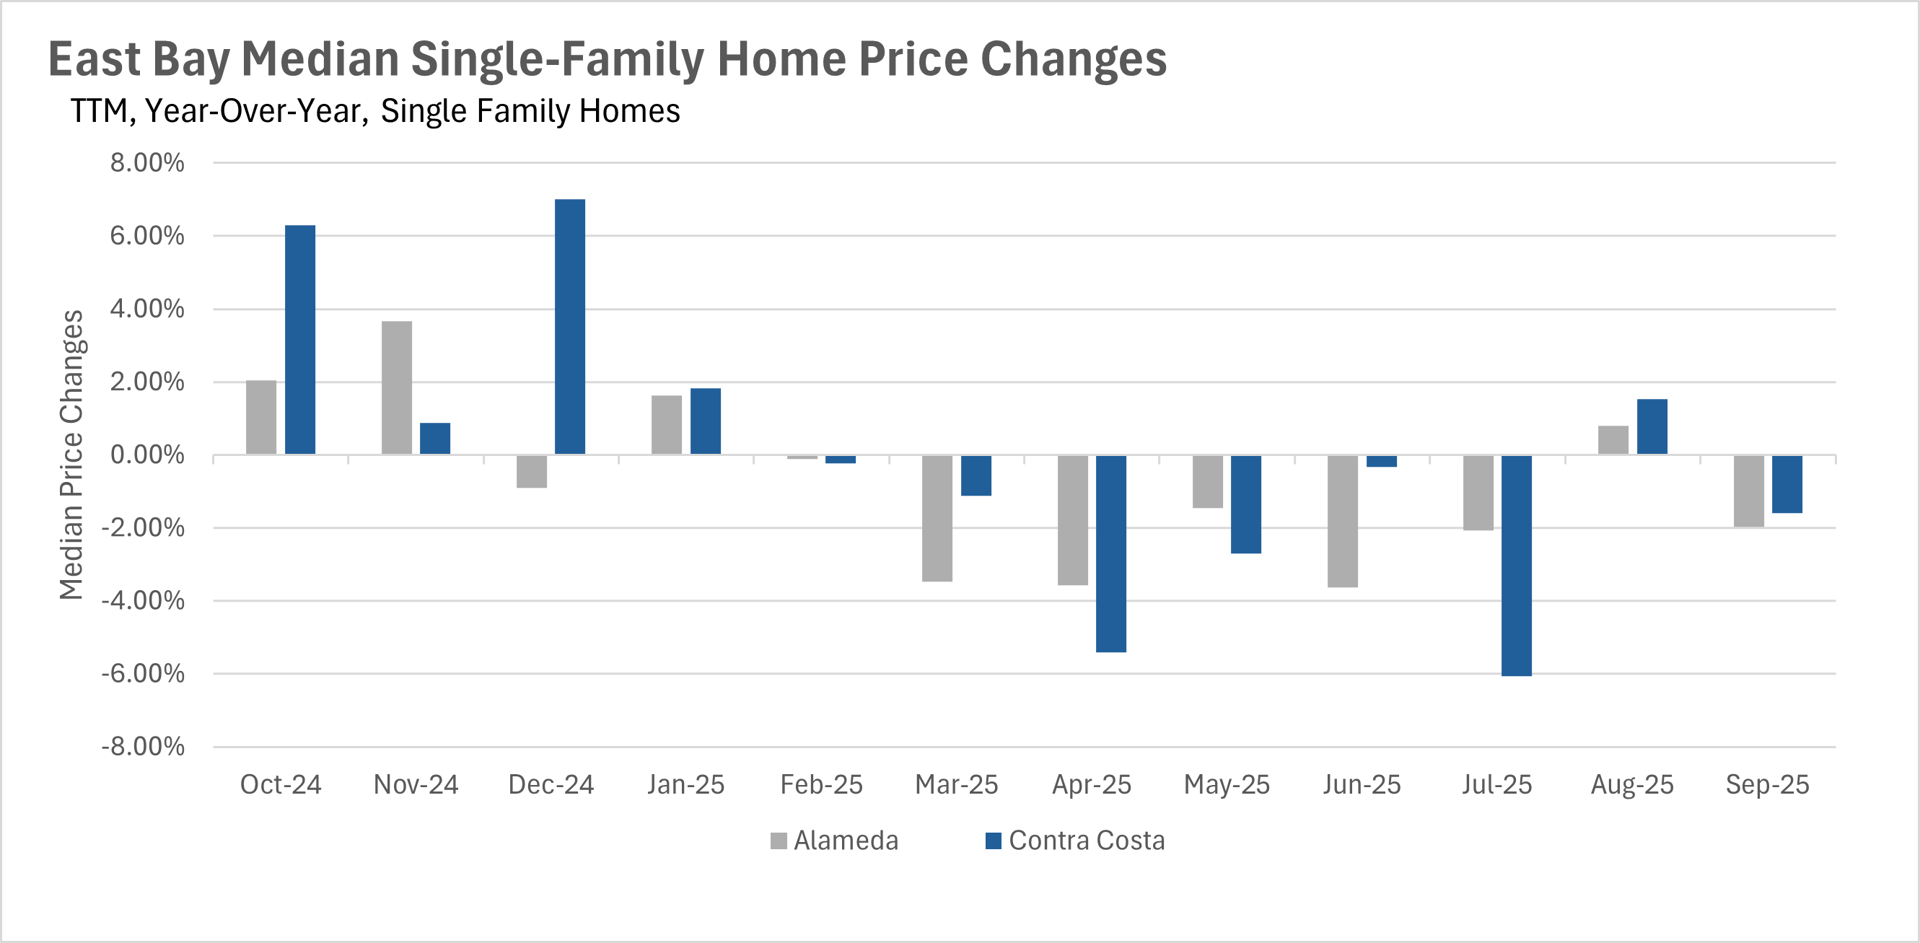
Single-family home median sale prices declined slightly on a year-over-year basis.
-
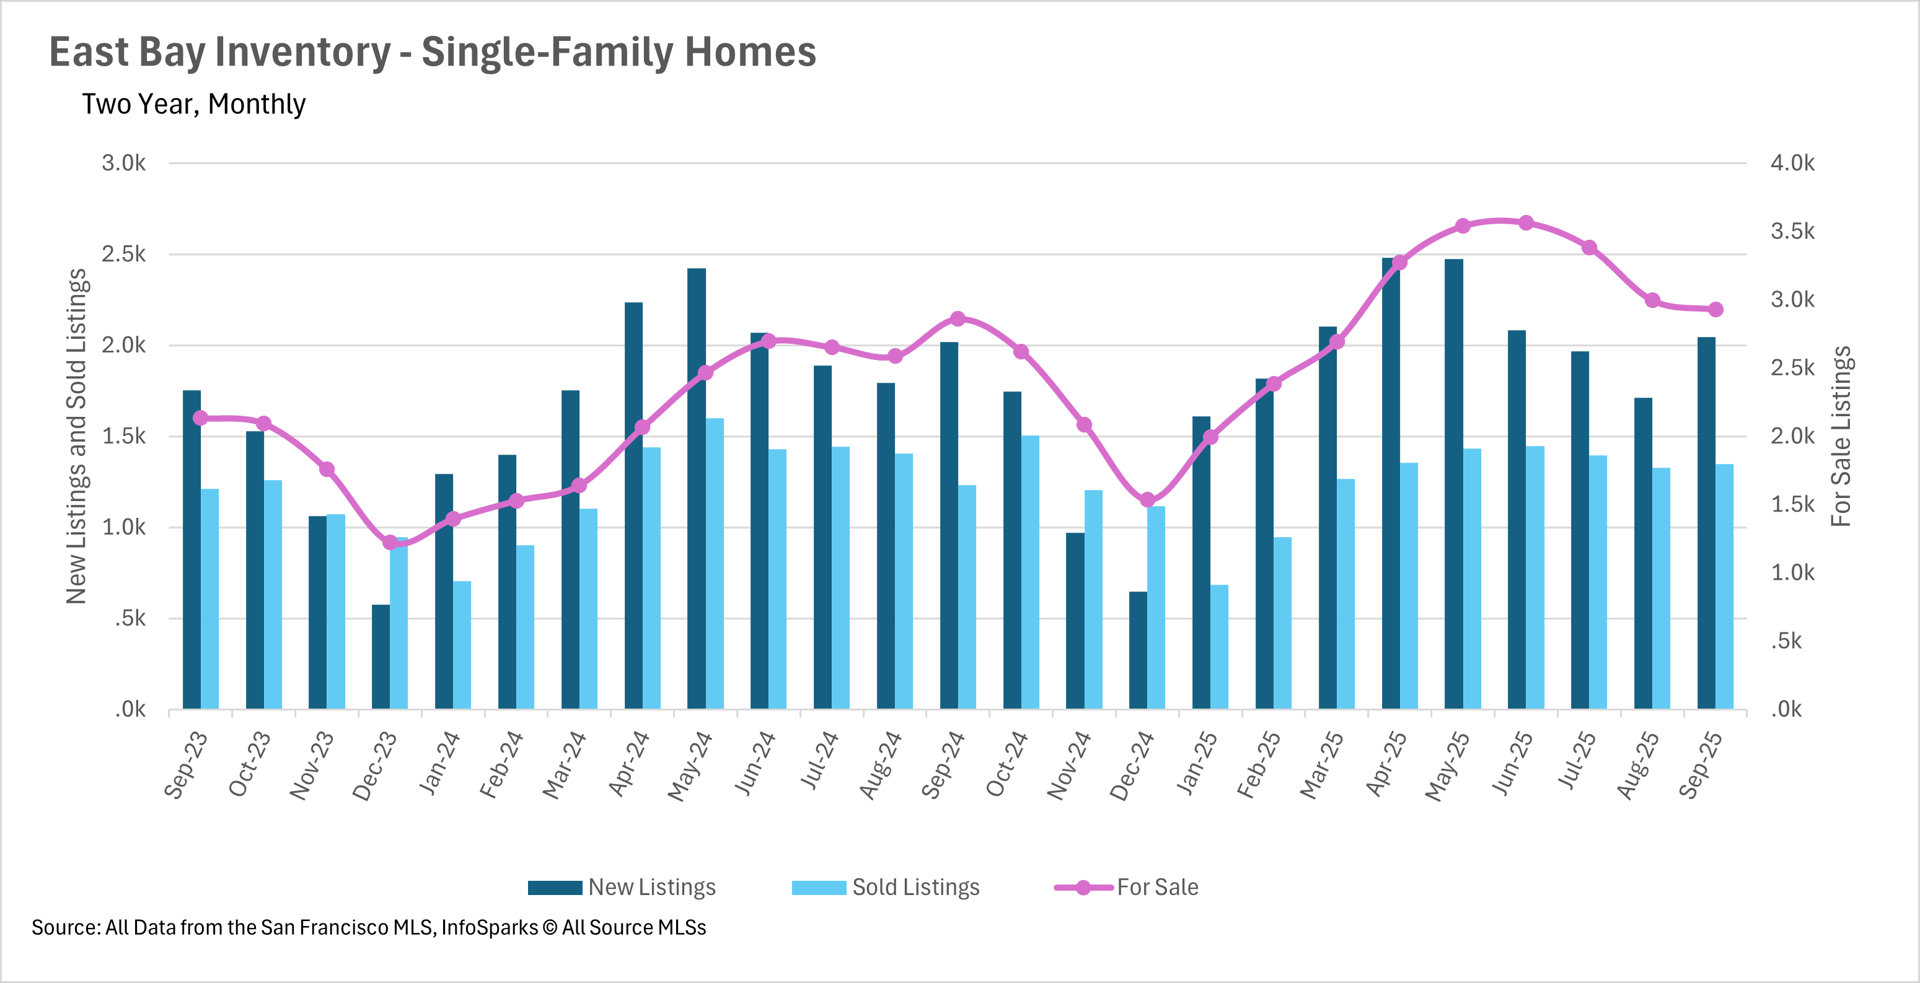
Inventories remain at a level that’s slightly higher than this time last year.
-
Listings are spending a lot more time on the market than they were last year, with single-family listings spending more than 20% longer on the market.
Note: You can find the charts/graphs for the Local Lowdown at the end of this section.
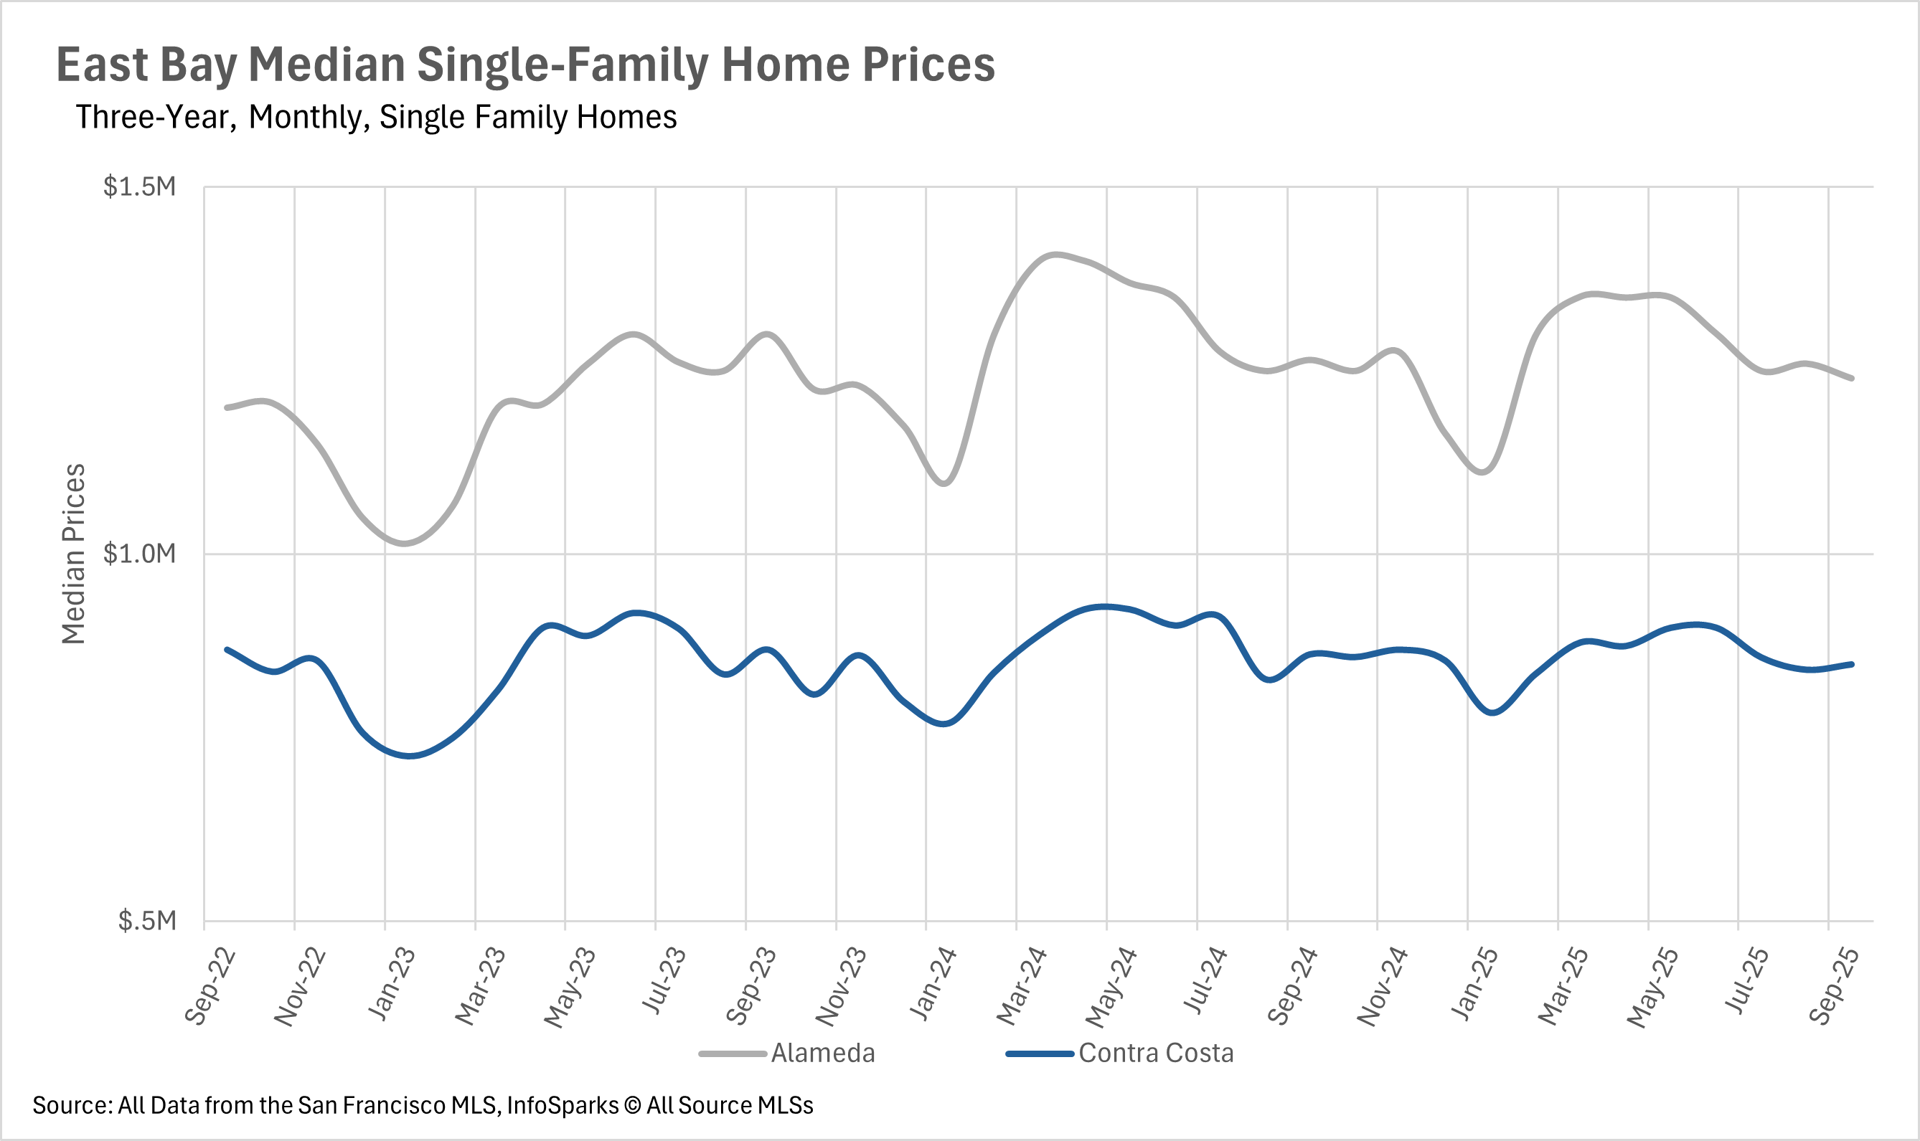
The East Bay returns to its year-over-year declines in median sale price
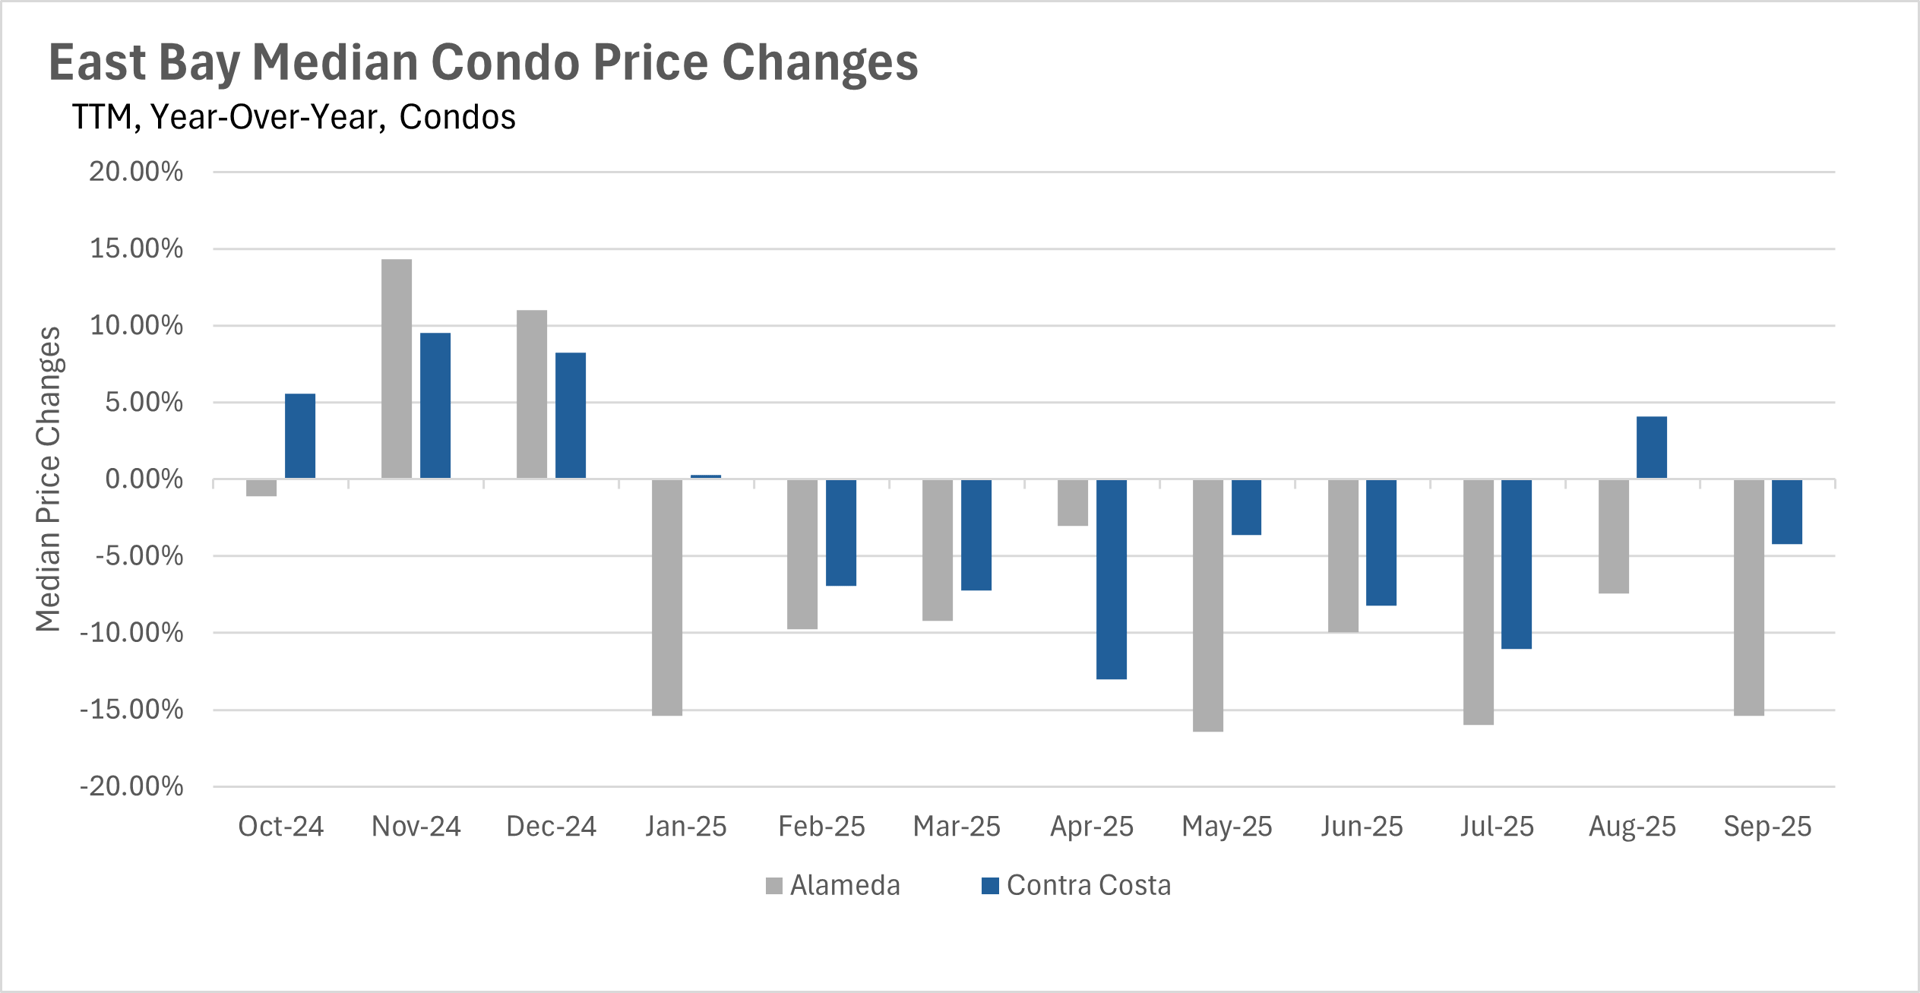
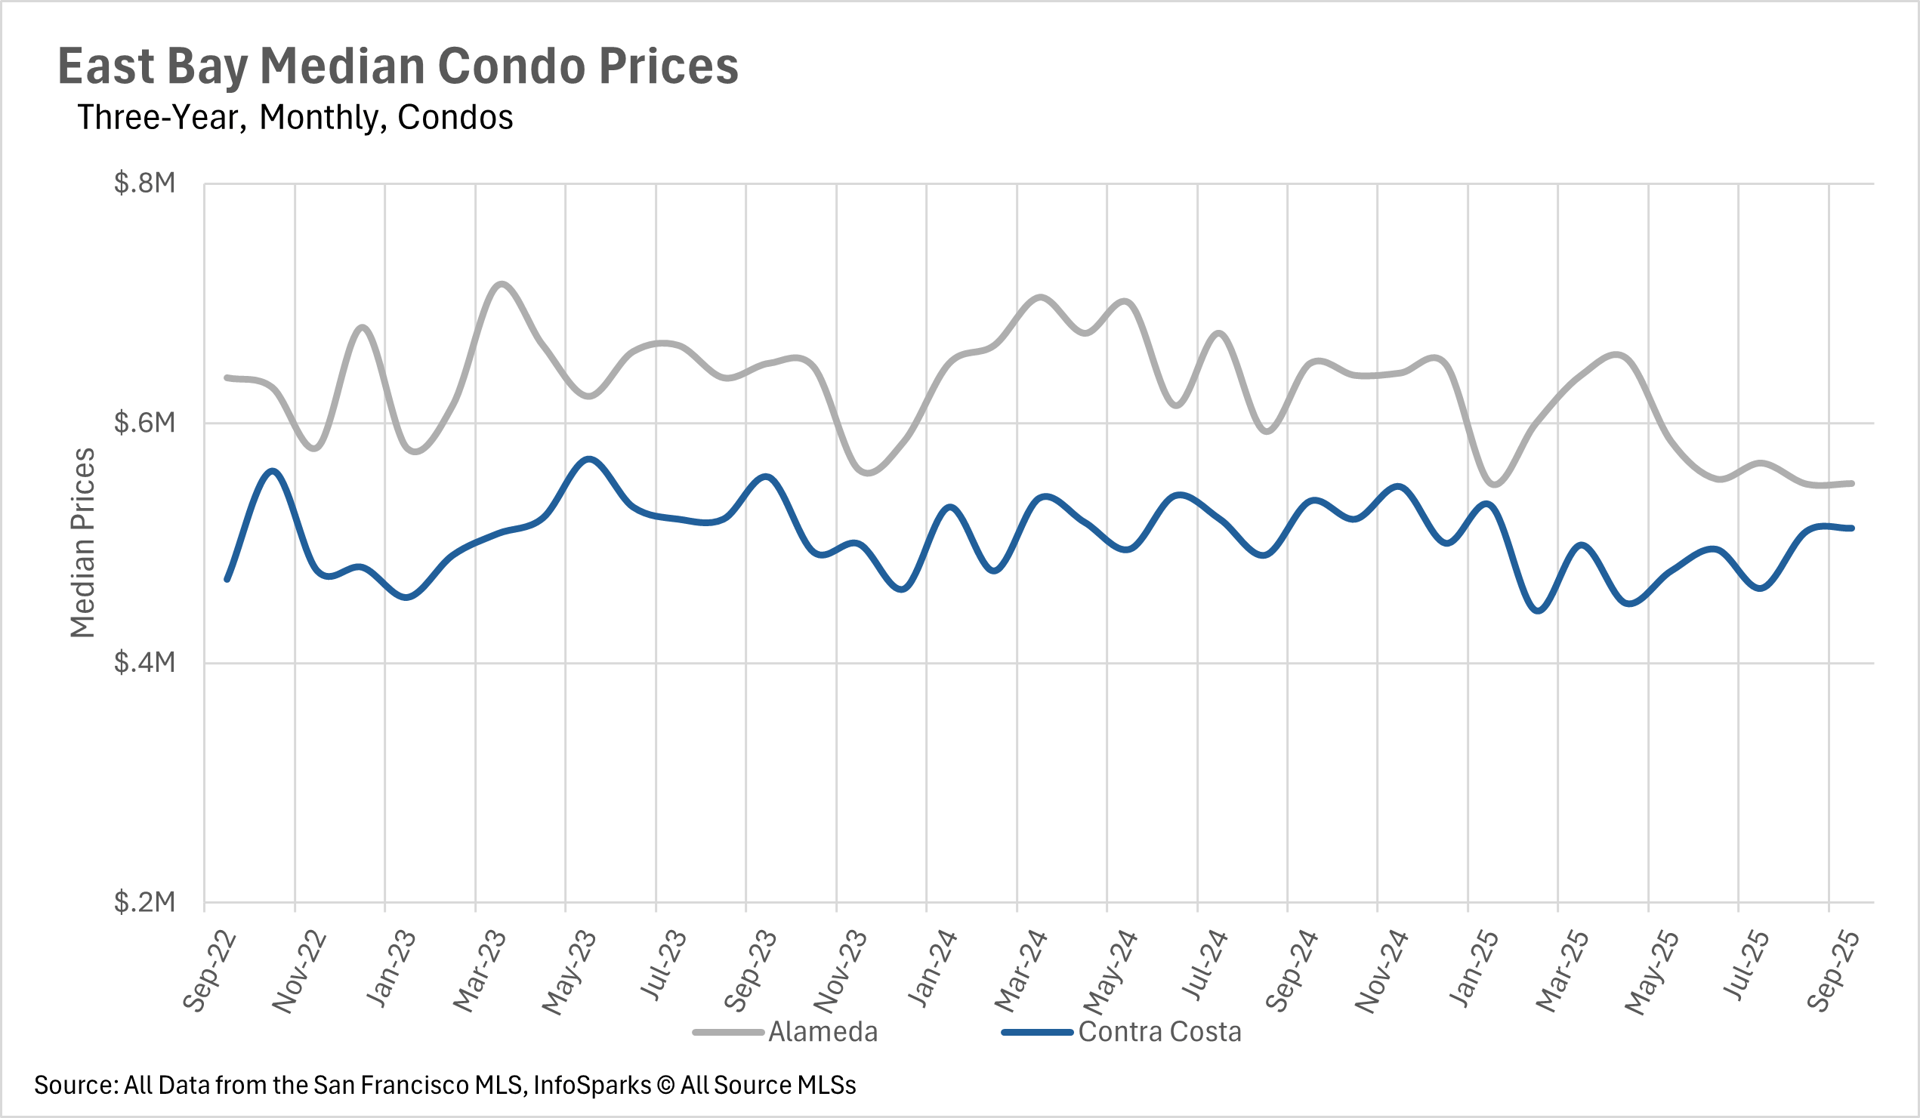
In the month of August, the East Bay bucked the trend of continual year-over-year declines in price. However, in September, this trend returned, as single-family median sale prices dipped by 1.59% in Contra Costa County and 1.98% in Alameda County. However, it’s important to note that listings in both of these areas look to be selling within the “band” of prices that they have historically sold at over the course of the past few years, so there’s no cause for concern yet! In the condo market, we did see some larger downward swings, with the median sale price for a condo in Contra Costa County declining by 4.21% on a year-over-year basis.
Inventories have begun to normalize, as summer buildup is sold off
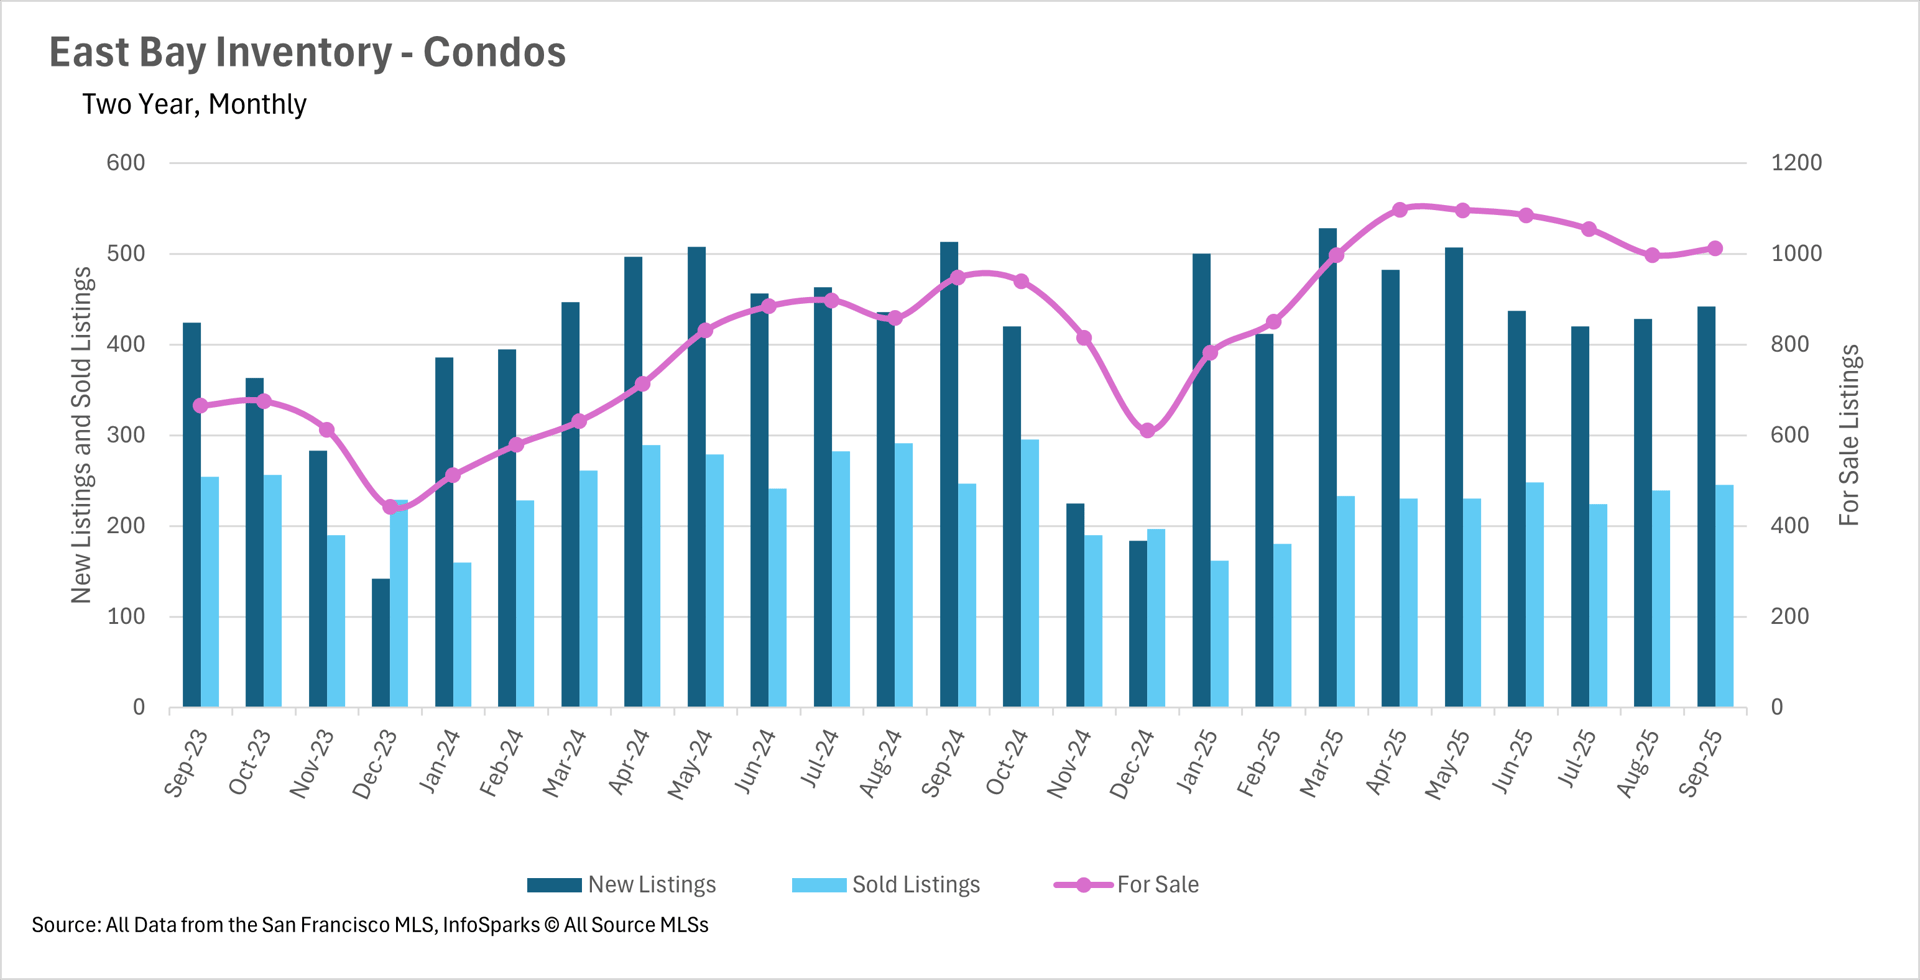
As we all know, throughout the summer, we saw a huge buildup of inventory, as homebuyers reeled from the economic uncertainty presented by tariffs and swings in the stock market. However, over the past couple of months, we’ve seen a lot of that buildup sell off, as inventories return to normal levels. This has left us with just 2.41% more inventory in the single-family home market and 6.75% more inventory in the condo market on a year-over-year basis. The normalization in the single-family home market can largely be attributed to the fact that we saw nearly 10% more homes sold in September than we did just a year ago!
Despite spending more time in the market, listings are still moving relatively quickly
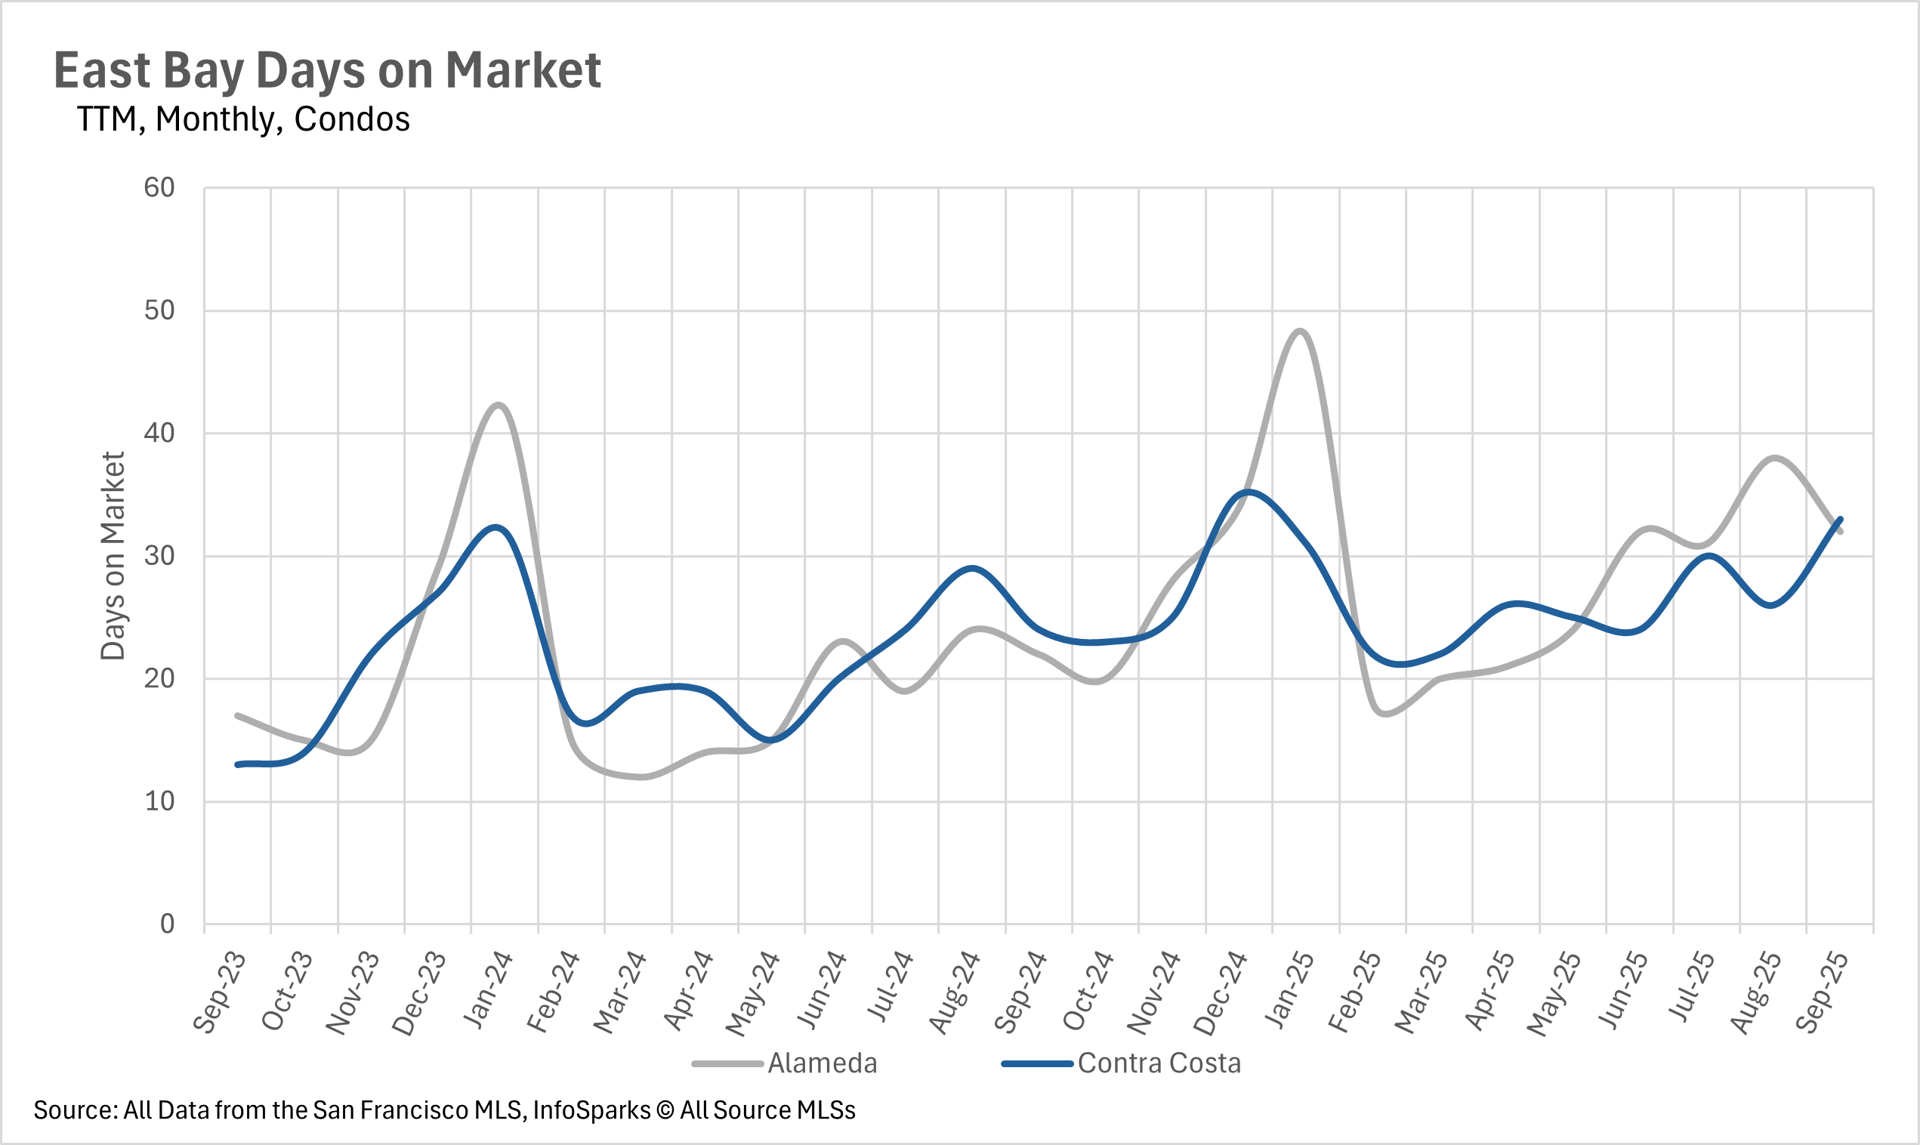
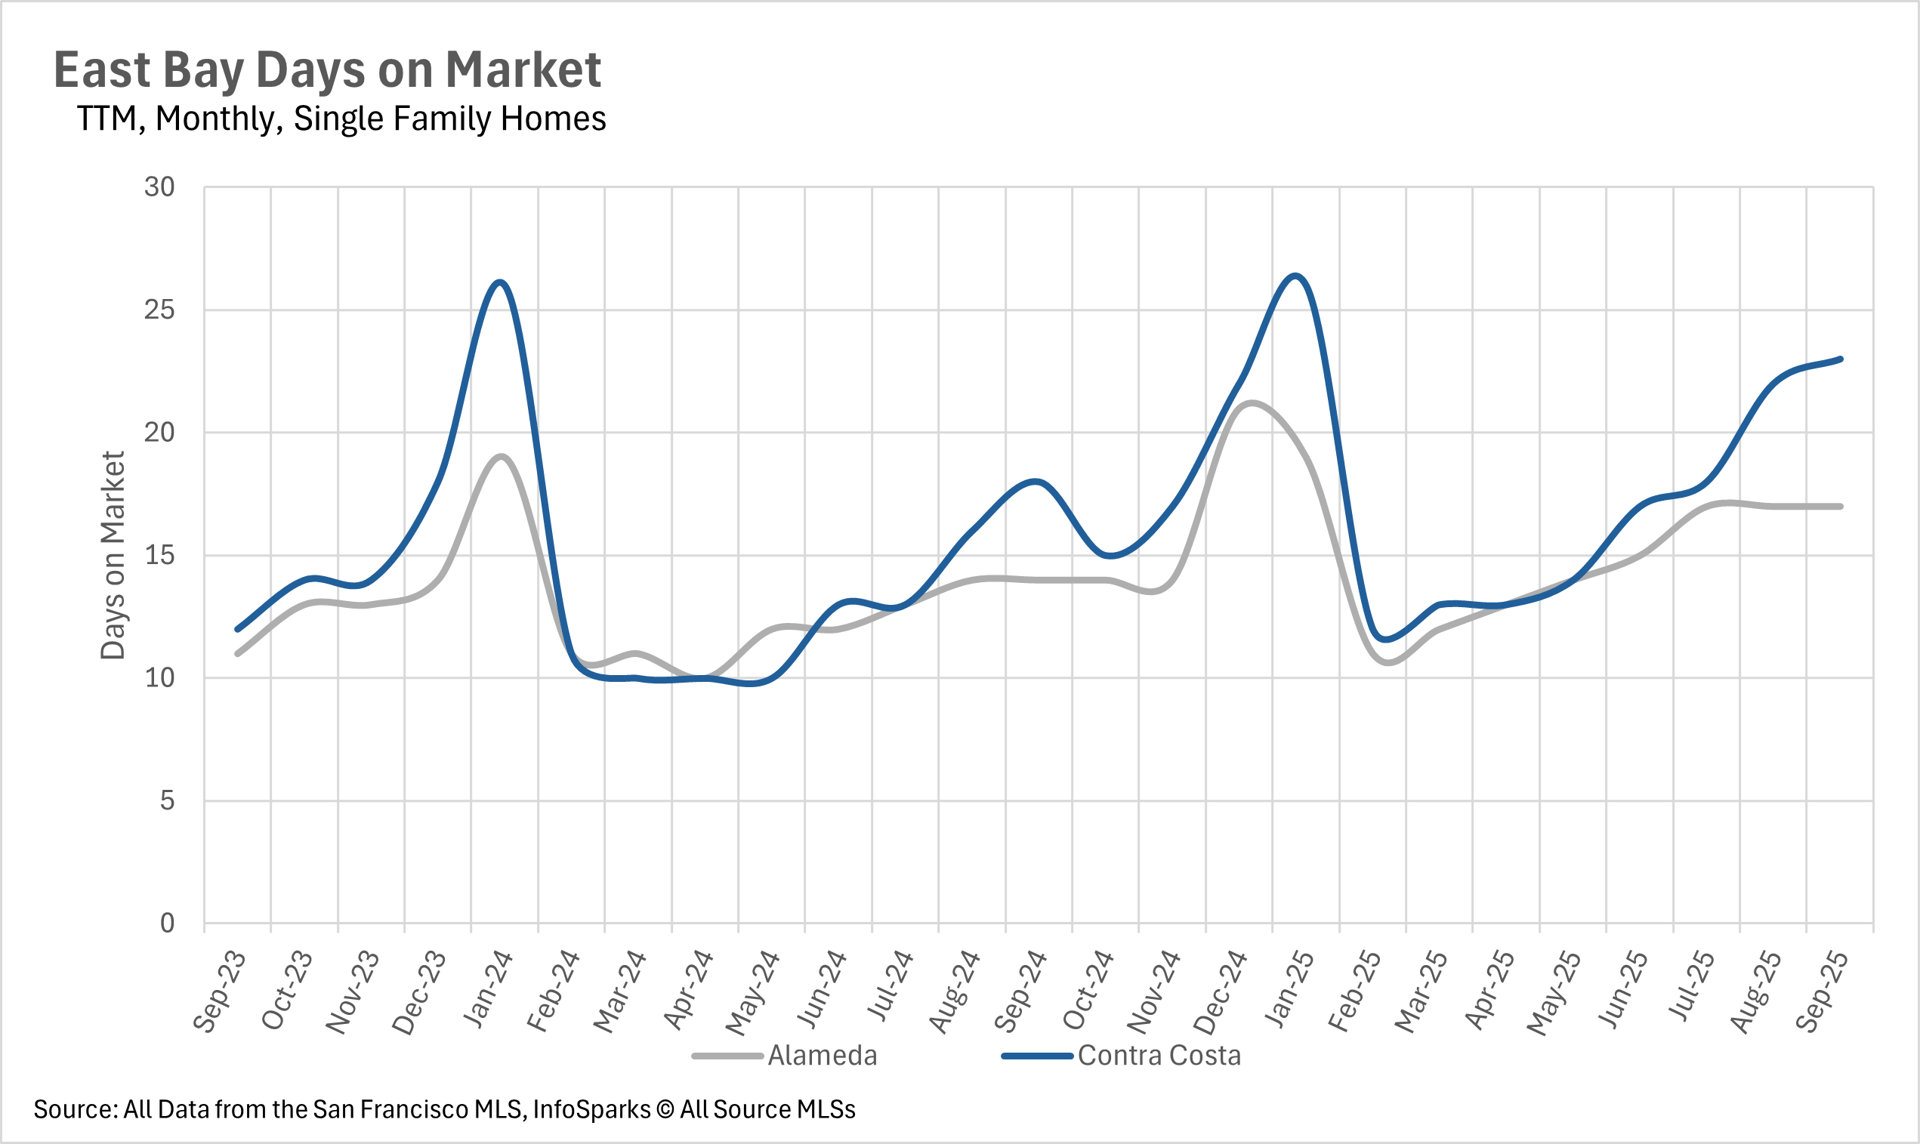
Although inventories are slowly normalizing, listings are spending quite a bit more time on the market on a percentage basis. The average single-family home listing in Alameda County is spending 21.43% more time on the market than this time last year, and the average Contra Costa County listing is spending 27.78% more time on the market. However, when you look at the absolute number of days that these listings are spending on the market, we see that they’re still moving relatively fast, with Alameda and Contra Costa County single-family homes spending just 17 and 23 days on the market, respectively. We see a similar phenomenon in the condo market with 45.45% and 37.50% year-over-year increases in Alameda and Contra Costa counties. However, average listings are spending 32 and 33 days on the market, respectively.
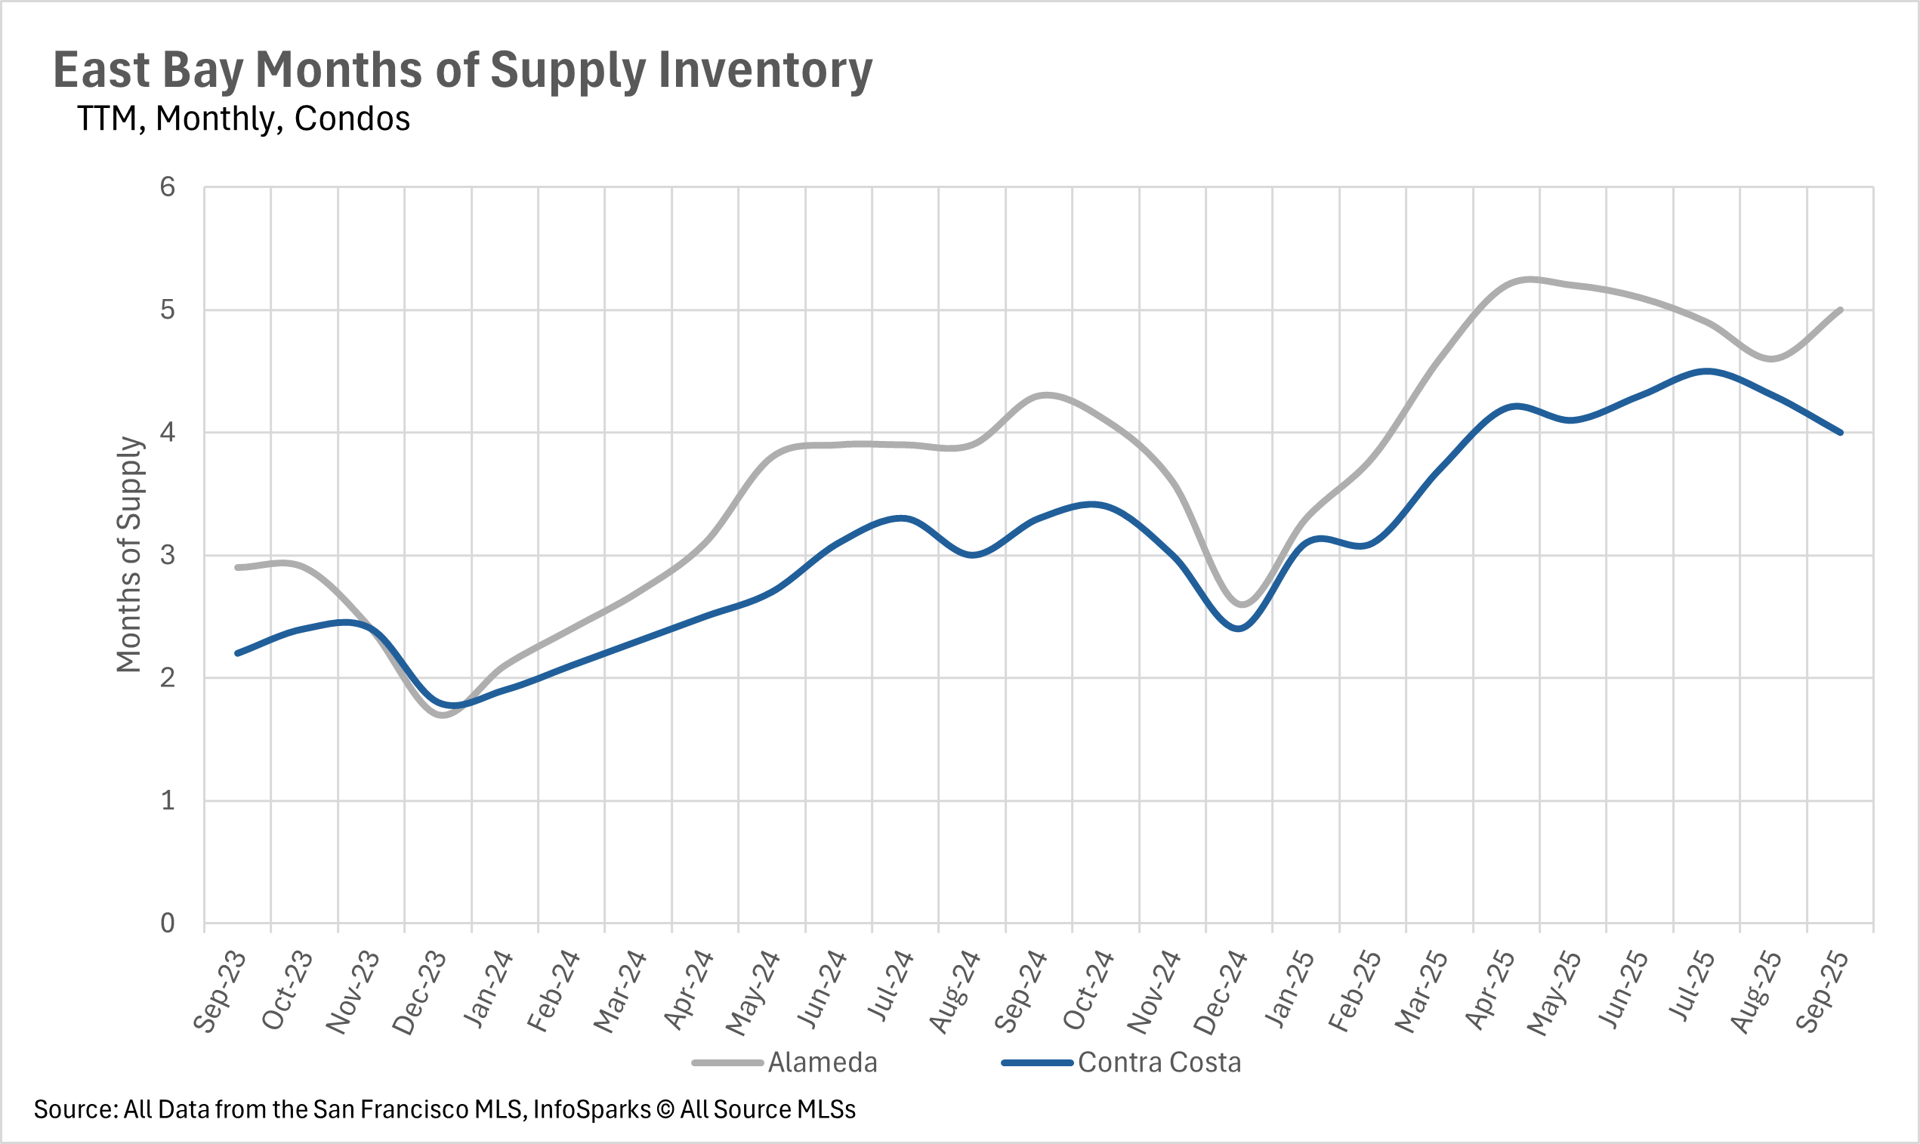
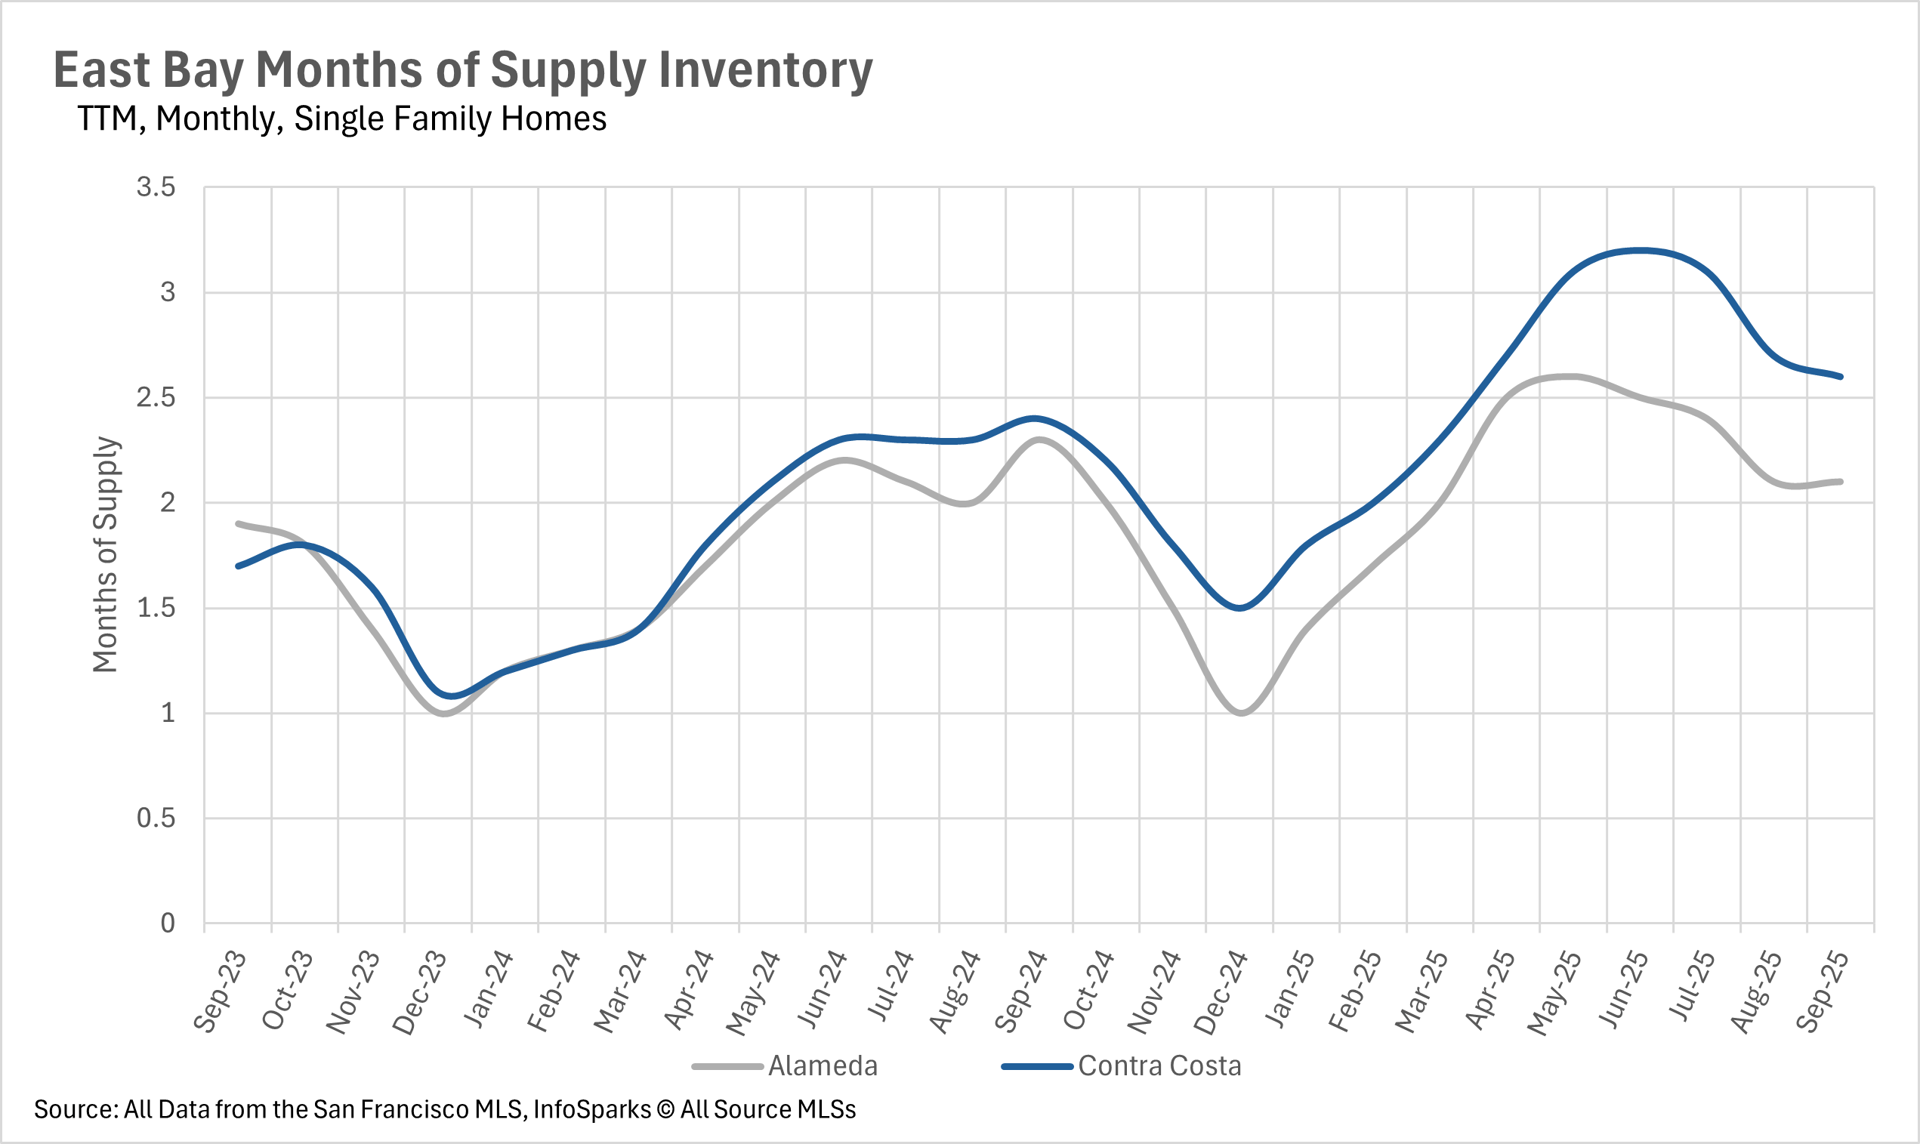
The single-family home market remains a seller's market, and the condo market remains a buyer's market
When determining whether a market is a buyers’ market or a sellers’ market, we look to the Months of Supply Inventory (MSI) metric. The state of California has historically averaged around three months of MSI, so any area with at or around three months of MSI is considered a balanced market. Any market that has lower than three months of MSI is considered a seller’s market, whereas markets with more than three months of MSI are considered buyers’ markets.
Over the course of the past month, there hasn’t been much of a change in terms of the state of the overall markets in the East Bay. Single-family home markets remain heavily within sellers' territory, with just 2.1 months of inventory on the market in Alameda County and 2.6 months in Contra Costa County. Whereas the condo market tells a much different story, with 5 months of inventory on the market in Alameda County and 4 months in Contra Costa County, making the condo market a buyer-dominated market.
Local Lowdown Data